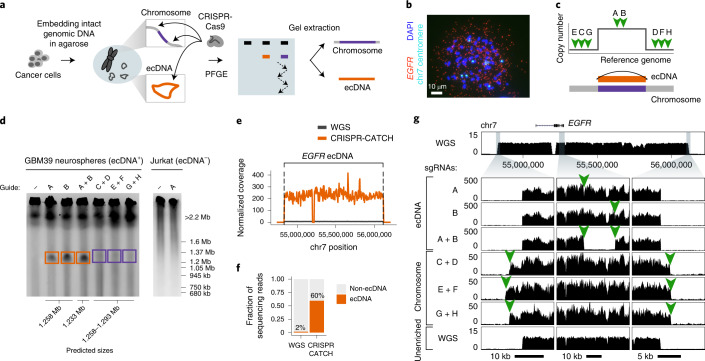
Fig. 1. Isolation of megabase-sized ecDNA and its native chromosomal locus from the same cancer cell sample by CRISPR-CATCH.
a, Experimental workflow for enrichment of ecDNA and its corresponding chromosomal locus from the same cell sample. b, A representative DNA FISH image on a metaphase spread from a GBM39 glioblastoma cell showing extrachromosomal EGFR signals and multiple chromosome 7 (chr7) signals (n = 65 cells). Quantification of copy numbers is shown in Extended Data Fig. 2a. DAPI, 4,6-diamidino-2-phenylindole. c, Design of CRISPR sgRNAs for linearizing ecDNA circles or extracting the native chromosomal locus. d, PFGE images showing linearized ecDNA molecules and the chromosomal locus after treatment with indicated guides (Methods; guide sequences in Supplementary Table 1). Boxed regions indicate parts of the gel that were extracted for DNA isolation. GBM39 ecDNA cutting and fractionation by PFGE were reproduced in three independent experiments. e, Normalized short-read sequencing coverage of the expected ecDNA locus in unenriched WGS or after CRISPR-CATCH (guide A). f, Fraction of total sequencing reads aligning to the expected ecDNA locus in unenriched WGS or after CRISPR-CATCH (guide A). g, Sequencing tracks showing coverages for enriched ecDNA and its chromosomal locus at the zoomed-in locations compared to WGS. Orange arrows indicate locations of sgRNA targets.

