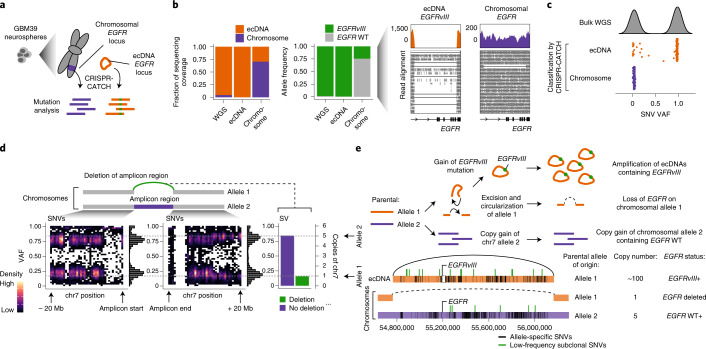
Fig. 3. Phasing of SVs and SNVs for ecDNA and its native chromosomal locus identified the chromosomal origin of ecDNA.
a, Isolation of ecDNA and the corresponding chromosomal locus from GBM39 neurospheres by CRISPR-CATCH followed by mutation analysis using short-read sequencing. b, Barplot showing relative sequencing coverage of ecDNA (guide A) and chromosomal DNA (guide E + F) (left) and variant allele frequencies (VAFs) of the EGFRvIII mutant on ecDNA and chromosomal DNA (middle). Sequencing coverage and junction reads supporting the EGFRvIII mutation and wild-type (WT; right). c, Bimodal distribution of VAFs of SNVs identified within the ecDNA-amplified region in bulk WGS (top). VAFs of SNVs classified by CRISPR-CATCH as either ecDNA-specific or chromosome-specific (bottom). d, Schematic of chromosomes with or without deletion of the ecDNA-amplified region (top). Density plots showing VAFs of non-homozygous SNVs (VAF < 0.99) in WGS 20 Mb upstream or downstream of the region corresponding to the ecDNA amplicon on chromosomes (bottom left). VAF of the SV resulting from deletion of the ecDNA amplicon region and reference sequence without deletion in WGS (bottom right). e, Sequence of genomic events leading to ecDNA amplification and chromosome 7 copy gain in GBM39 cells (top). Visualization of all allele-specific genetic variants on ecDNA and chromosomal DNA and their parental alleles of origin identified by CRISPR-CATCH (bottom).

