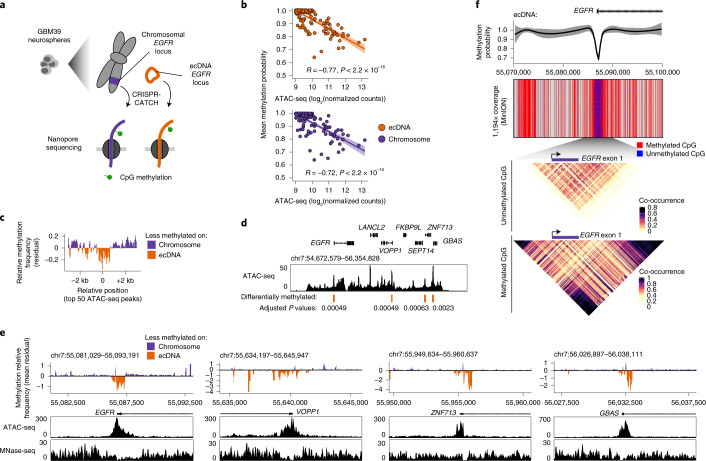
Fig. 4. Comparison of CpG methylation statuses of ecDNA and its native chromosomal locus showed hypomethylation of gene promoters on ecDNA.
a, Isolation of ecDNA (guide A) and the corresponding chromosomal locus (guides E + F) from GBM39 neurospheres by CRISPR-CATCH followed by detection of 5mC-CpG methylation by nanopore sequencing. b, Negative correlation between mean methylation probabilities of ATAC-seq peaks and their ATAC-seq signals (Pearson’s R, two-sided test; error bands represent 95% confidence intervals). c, Aggregated levels of relative CpG methylation of ecDNA compared to the chromosomal locus at top 50 ATAC-seq peaks in the ecDNA-amplified region. Mean methylation frequencies were calculated in 100-bp windows sliding every 10 bp. Relative frequencies were quantified from standardized residuals for a linear regression model for mean frequencies on ecDNA vs. chromosomal DNA (Methods). d, Bulk ATAC-seq track with differentially methylated regions annotated (Methods; two-sided z-test, P values were Benjamini-Hochberg adjusted; regions with P < 0.005 were considered significant). e, Relative CpG methylation of ecDNA compared to the chromosomal locus in differential regions and concordance with accessibility by ATAC-seq and nucleosome positioning by MNase-seq. Mean methylation frequencies were calculated in 100-bp windows sliding every 10 bp. Relative frequencies were quantified from standardized residuals for a linear regression model for mean frequencies on ecDNA vs. chromosomal DNA (Methods). f, From top to bottom: Loess-smoothed methylation probability around the EGFR promoter (error band represents 95% confidence intervals); nanopore sequencing reads showing CpG methylation calls (gray denotes regions with no CpG sites); heatmap showing co-occurrence probabilities of unmethylated CpG sites on the same molecules; heatmap showing co-occurrence probabilities of methylated CpG sites on the same molecules (Methods). Reads were collected using a MinION sequencer (Oxford Nanopore Technologies).

