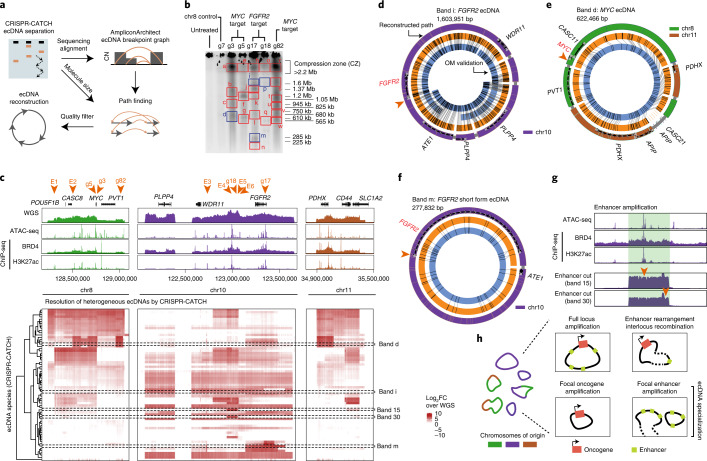
Fig. 5. Identification of diverse ecDNA species revealed heterogeneous structural rearrangements and an altered enhancer landscape.
a, Analysis of ecDNA structure using CRISPR-CATCH. ecDNA species are separated by size in PFGE and sequenced. AmpliconArchitect generates CN-aware breakpoint graphs, which are used in combination with molecule sizes from PFGE to find paths and identify candidate ecDNA structures. b, PFGE image for SNU16 after treatment with independent sgRNAs targeting either the FGFR2 or MYC locus (guide sequences in Supplementary Table 1). PFGE result is representative of two independent experiments. Bands passing all quality filters for reconstruction are shown in blue. c, From top to bottom: WGS, ATAC-seq, BRD4 and H3K27ac chromatin immunoprecipitation with sequencing (ChIP-seq); heatmap showing enrichment of multiple structurally distinct ecDNA species by CRISPR-CATCH. ecDNA species were isolated from bands shown in PFGE gels in panel b and Extended Data Fig. 8c. Orange arrows on the top mark all sgRNA target sites. d–f, ecDNA reconstructions using CRISPR-CATCH data (outer rings indicate coordinates along reference genome and gene bodies, and thin gray bands mark connections between sequence segments). OM patterns (orange rings) and assembled contigs (blue rings, contig IDs indicated) validated CRISPR-CATCH reconstructions. Orange arrows mark sgRNA target sites. An FGFR2 ecDNA structure containing the full amplicon locus was reconstructed from band ‘i’ as shown in panel d. A MYC ecDNA reconstructed from band ‘d’ containing sequences from chromosomes 8 and 11 is shown in panel e. A short-form FGFR2 ecDNA reconstructed from band ‘m’ is shown in panel f. g, Sequencing coverage of ecDNAs (bands 15 and 30 correspond to bands extracted from gel in Extended Data Fig. 8c). Region highlighted in green denotes enhancer amplification. ATAC-seq, BRD4 and H3K27ac ChIP-seq show locations of enhancers. Orange arrows mark sgRNA target sites. h, Schematic showing diverse ecDNA structures and an altered enhancer landscape revealed by CRISPR-CATCH. FC, fold change.

