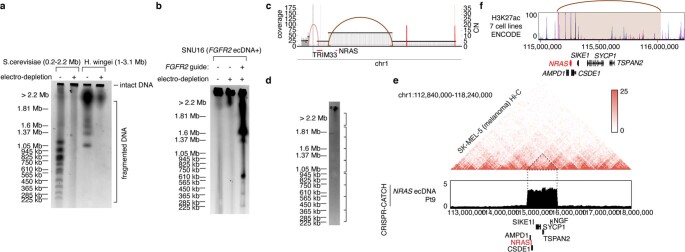
Extended Data Fig. 3. Tumor processing and ecDNA enrichment from patient tumor samples using CRISPR-CATCH.
(a) A PFGE image showing presence of DNA bands from S. cerevisiae and H. wingei DNA size markers with or without electrodepletion. One independent experiment was performed. (b) A PFGE image showing linearized ecDNA molecules from SNU16 cells containing FGFR2 ecDNAs after electrodepletion and treatment with an FGFR2 guide (guide 17; guide sequence in Supplementary Table 1). One independent experiment was performed. (c) AmpliconArchitect breakpoint graph from bulk WGS of melanoma patient tumor Pt9 showing amplification of NRAS. (d) A PFGE image from melanoma patient sample Pt9 after electrodepletion and CRISPR-CATCH using NRAS-targeting guide 194 (guide sequence in Supplementary Table 1). Brackets on the right correspond to gel-extracted regions shown in Fig. 2c. One independent experiment was performed. (e) Top: raw Hi-C contact heatmap for the SK-MEL-5 melanoma cell line (40-kb resolution). Bottom: sequencing track showing CRISPR-CATCH-enrichment of the NRAS ecDNA from melanoma patient tumor Pt9. (f) Layered H3K27ac ChIP-seq tracks from 7 cell lines (GM12878, H1-hESC, HSMM, HUVEC, K562, NHEK, NHLF) in ENCODE using the UCSC Genome Browser. Brown arc marks ecDNA breakpoints. Shaded brown region marks the NRAS ecDNA amplicon detected in patient sample Pt9.

