
Figure 7:
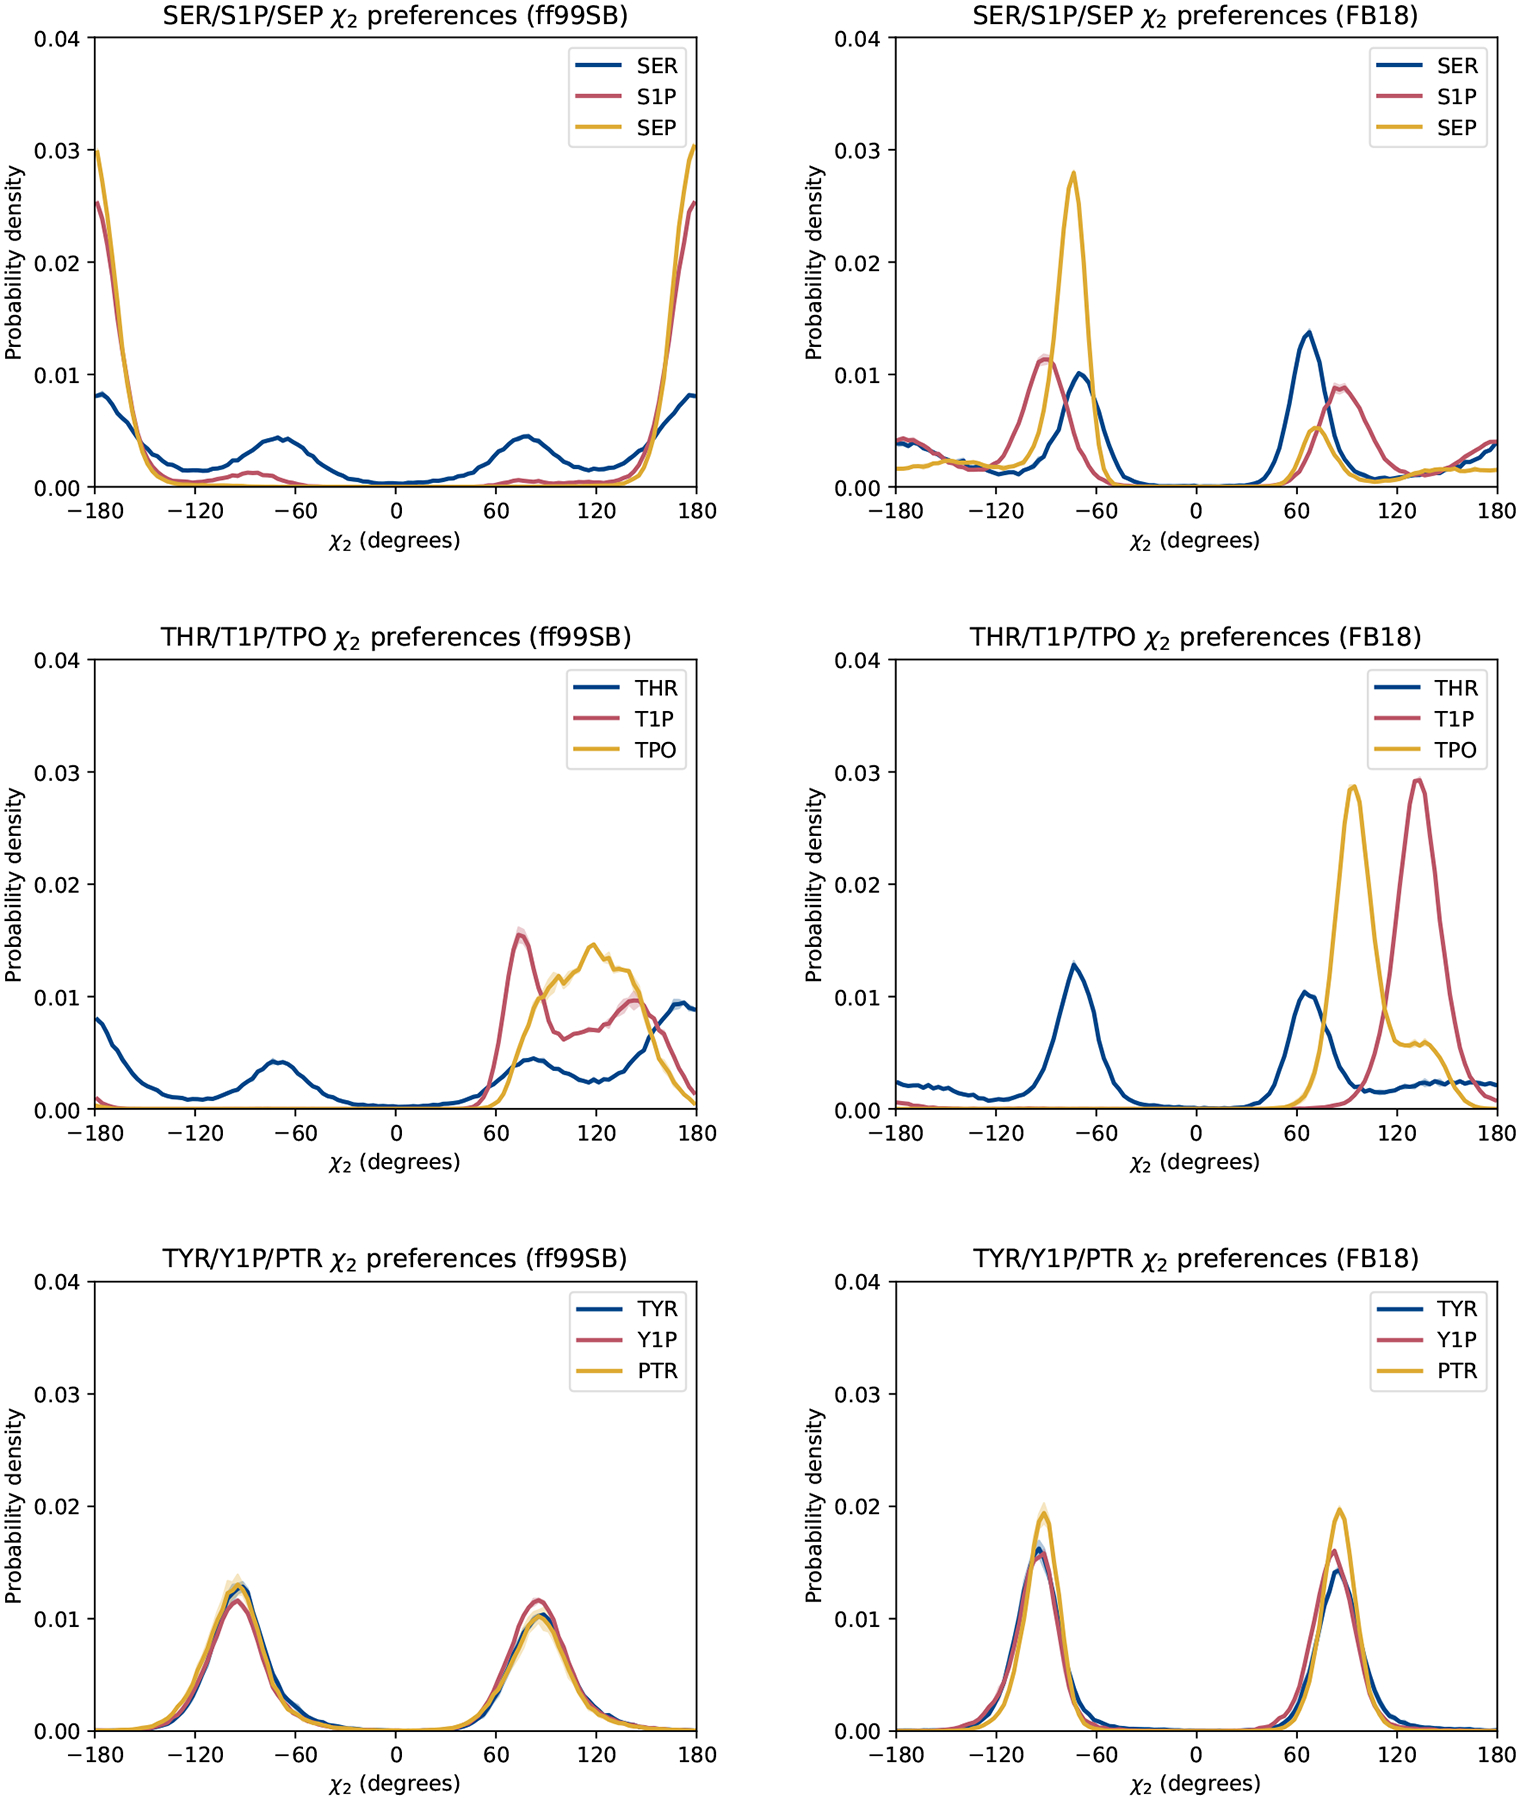
Comparison of χ2 side chain conformational preferences: results obtained with ff99SB (left) and FB18 (right). Lines represent the average between two halves of the simulations. Shaded regions represent the differences between the two halves.