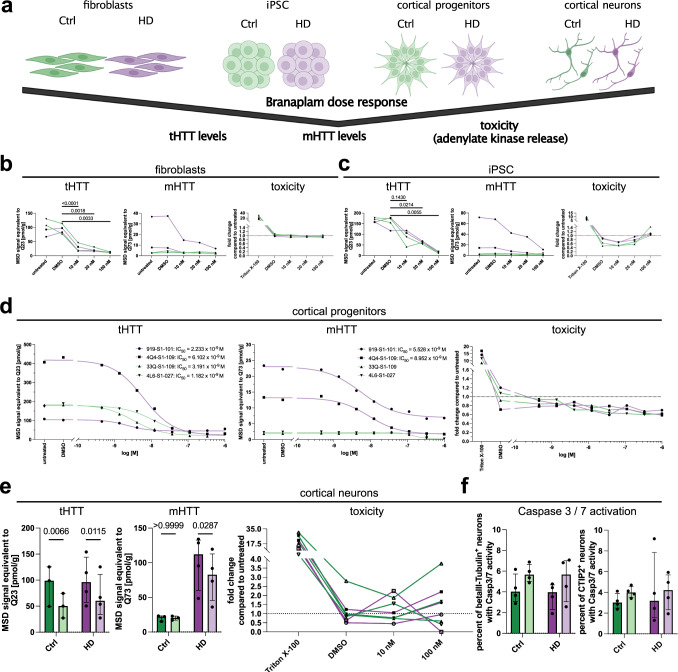
Fig. 3. Branaplam reduces total and mutant HTT protein levels in a dose-dependent manner without inducing toxicity.
a Paradigm: cell types and parameters analyzed. Created with BioRender.com. b–d tHTT levels (2B7/D7F7 assay), mHTT levels (2B7/MW1 assay) and toxicity (adenylate kinase release, Triton: positive control) in fibroblasts (b), iPSC (c) and cortical progenitors (d) with different Branaplam concentrations for 72 h. Green: Ctrl samples (n = 2 33Q/33Q-S1-109, 4L6/4L6-S1-027), purple: HD samples (n = 2 919/919-S1-101, 4Q4/4Q4-S1-109). b Fibroblasts statistics: tHTT: one-way ANOVA with Geisser–Greenhouse correction (P = 0.0012); mHTT: no statistics applied; toxicity (Triton excluded): Friedman test (P = 0.0770). c iPSC statistics: tHTT one-way ANOVA with Geisser–Greenhouse correction (P = 0.0032); mHTT: no statistics applied; toxicity (Triton excluded): one-way ANOVA with Geisser–Greenhouse correction (P = 0.0455), no significant differences in multiple comparisons. d cortical progenitor statistics: tHTT IC50: 919-S1-101 = 2.233 × 10⁻⁹ M; 4Q4-S1-109 = 6.102 × 10⁻⁹ M; 33Q-S1-109 = 3.191 × 10⁻⁹ M; 4L6-S1-027 = 1.182 × 10⁻⁹ M; mHTT: 919-S1-101 = 5.528 × 10⁻⁹ M; 4Q4-S1-109 = 8.952 × 10⁻⁹ M; 33Q-S1-109 and 4L6-S1-027 = not calculated; toxicity (Triton excluded): one-way ANOVA with Geisser–Greenhouse correction (P = 0.06). e tHTT levels (2B7/D7F7 assay), mHTT levels (2B7/MW1 assay) (Ctrl n = 3; HD n = 4) and toxicity (adenylate kinase release, Triton as positive control) in cortical neurons of (Ctrl n = 4; HD n = 4). tHTT and mHTT measured with DMSO (dark shades) or 10 nM Branaplam (light shades) for 72 h. Statistics: tHTT: 2-way ANOVA (DMSO vs. Branaplam: P = 0.0009; Ctrl vs. HD: P = 0.6820; interaction: P = 0.3833); mHTT: two-way ANOVA (DMSO vs. Branaplam: P = 0.0614; Ctrl vs. HD: P = 0.0223; interaction: P = 0.0615); toxicity (Triton excluded): Friedman test (P = 0.5306). Bars: median ± IQR. f Bar plot showing number of Casp3/7 positive beta-III-Tubulin+ and CTIP2+ cortical neurons after DMSO (dark shades) or (light shades) 72 h 10 nM Branaplam treatment (Ctrl n = 4; HD n = 4). Statistics: beta-III-Tubulin+: two-way ANOVA (DMSO vs. Branaplam: P = 0.0782; Ctrl vs. HD: P = 0.4744; interaction: P = 0.9502); CTIP2+: 2-way ANOVA (DMSO vs. Branaplam: P = 0.7230; Ctrl vs. HD: P = 0.5779; interaction: P = 0.6348). Bars: median ± IQR. Source data are provided as a Source Data file.

