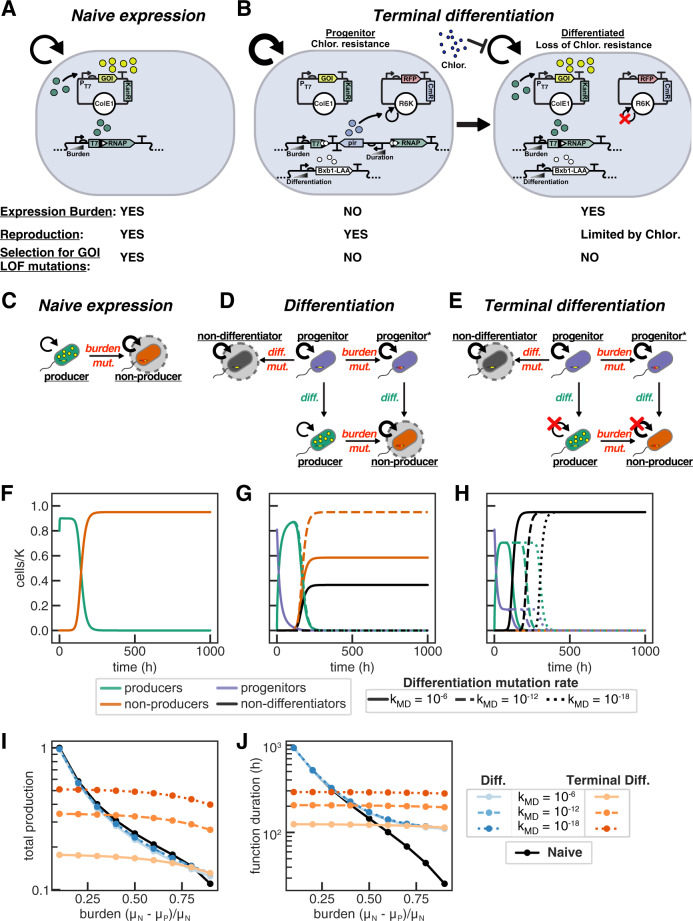
Fig. 1. Strategies for burdensome expression.
Experimental circuit design for (A) naive T7 RNAP-driven expression and (B) integrase-differentiation mediated activation of T7 RNAP which allows antibiotic selection against differentiated cells for terminal differentiation. C–E Cartoon depictions of naive expression (C), differentiation-activated expression (differentiation) (D), and differentiation-activated expression in which the number of cell divisions following differentiation is limited (terminal differentiation) (E). The thickness of the circular arrow indicates the relative growth rate, and states which are sinks are circled. F–J Deterministic ODE modeling of burdensome expression with circuits (C–E) growing with constant dilution and carrying capacity limited growth. D = 0.1 h−1, μN = 2 h−1, kMB = 10−6 ( is doubling time, μ is growth rate which varies over time due to the effect of carrying capacity), ndiv = 4, K = 109, initial cell population 8×10⁸ cells, 1000 h duration, and varying differentiation mutation rate for differentiation and terminal differentiation (solid line: kMD = 10−6 ; long-dashed: kMD = 10−12 ; short-dashed: kMD = 10−18 ). F–H Abundance of subpopulations plotted over time with burden due to production of 50% (μP = 1 h−1). Producers (green) express the function and have a reduced growth rate, while all other cells (non-producers (orange), progenitors (purple), non-differentiators (black)) have a higher growth rate (μN). I Total production and J duration of function (time at which production is 95% of max) plotted versus production burden for each strategy: Naive (black); differentiation (blues), terminal differentiation (reds), decreasing kMD light to dark).

