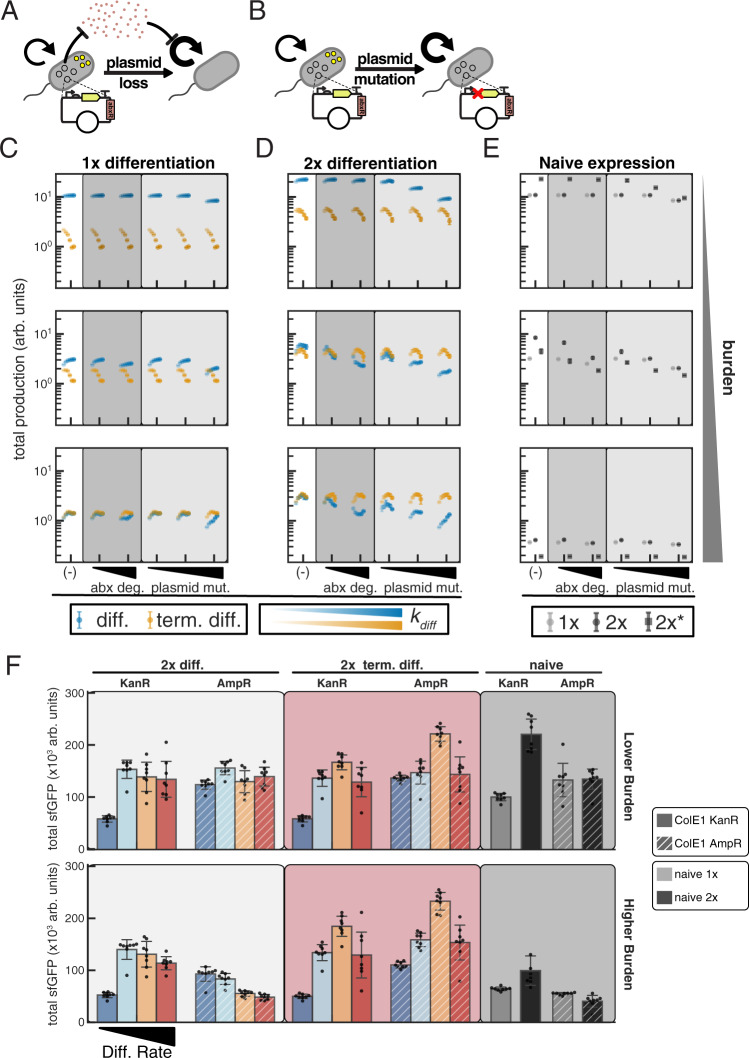
Fig. 3. Terminal differentiation is robust to plasmid effects which hinder naive and differentiation architectures.
A Schematic describing stochastic loss of burdensome plasmid which encodes an antibiotic resistance gene that allows for communal degradation. B Schematic describing stochastic plasmid mutation which relieves burden but does not impact antibiotic resistance. C–E Stochastic simulations of burdensome production in (C) 1x differentiation (blue) and terminal differentiation (orange), (D) 2x differentiation (blue) and terminal differentiation (orange), and (E) 1x (grey), 2x (black circles), and 2x* (black squares) naive architectures. Mean total production ± SD of 8 stochastic simulations of 20 consecutive batch growths with 50x dilutions. μP = 2 h−1; 10, 50, 90 percent burden (increasing top to bottom); K = 109 cells; kMB (burden mutation) = kMD (differentiation mutation) = kMI (integrase mutation) = 10−6 × μ; kdiff = 0.2, 0.4, 0.6, 0.8, 1, 1.2 h−1 (increasing left to right, light to dark shades); ndiv = 4. Production rate and burdens/growth rates as described in Supplementary Note 1. Naive 2x indicates a cell with two functional cassettes is described by the indicated burden level (; ), and growth and production rates of cells with one functional cassette (; ) described by Eq. 1 and Eq. 2. Naive 2x* indicates one functional cassette yields the indicated burden (; ), with growth and production rates for cells with two functional cassettes described by Eq. 3 and Eq. 4. Similarly, the growth/production rates for 2x differentiation are equivalent to 1x naive when 1 cassette is activated, and 2x* naive when 2 cassettes are activated. Simulations with antibiotic degradation are with plasmid loss rate kPL = 10−4 × μ; 100 μg/mL antibiotic; minimum inhibitory concentration MIC = 1.1 μg/mL; and antibiotic degradation, 2.52 × 10⁻⁶, and 1.26 × 10⁻⁵ μg/cell/h (left to right increasing abx deg). Simulations with plasmid mutation were modeled with kPL = 10−8, 10−6, 10−4 × μ (increasing left to right), 0 μg/mL antibiotic, and Vmax = 0. F Comparison of total endpoint production after 16 plate generations for ColE1-KanR (solid) and ColE1 AmpR (diagonal stripes) variants of 2× differentiation (-chlor, light-gray shaded), 2× terminal differentiation (+chlor, red shaded), and 1x/2x naive (gray bars/black bars; gray shaded) with varying salicylate (10, 15, 20, 30 μΜ: dark blue, light blue, orange, red, respectively) and IPTG (10, 50 μΜ; lower, higher burden). Mean ± SD (n = 8 independent colonies) total endpoint GFP production plotted, with individual values plotted (black circles). Source data are provided as a Source Data file.

