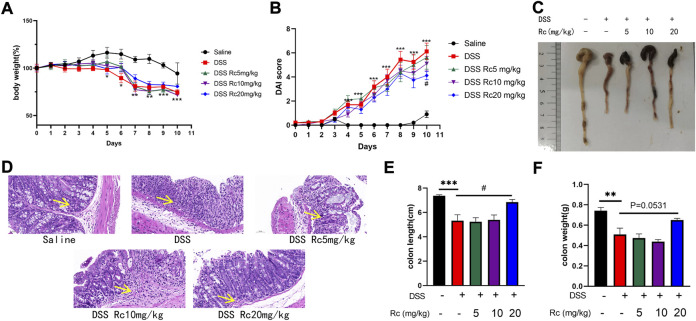
FIGURE 2.
Rc ameliorated DSS-induced UC in mice. Body weight (A) changes and disease activity index (B) during the whole experiment; macroscopic observation of colon length (C); representative H&E-stained colon sections (magnification: 200 ×) (D); the statistics of colon weight (E) and colon length (F). Data are shown as the mean ± SEM (n = 10). *p < 0.05, **p < 0.01, ***p < 0.001 vs. the saline group; #p < 0.05 vs. the DSS group.

