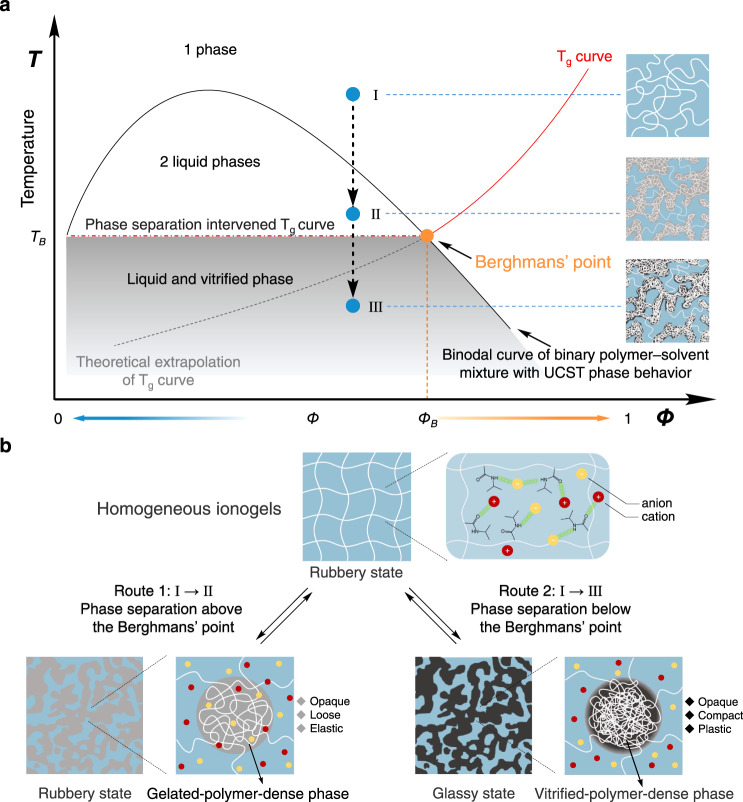
Fig. 1. Stiffness-changing mechanism of polymer networks.
a An illustrative phase diagram of solvent-polymer demixing interferes with the glass transition of the polymer. The broken line is the theoretical extrapolation of the glass transition line. At lower polymer concentrations (Φ < ΦB), a concentration-independent glass transition temperature (Tg = TB) is expected as presented by dot-dashed line. b Evolution of structures and states of ionogels quenching at different temperatures. Difference in polymer-dense phases are depicted when the system quenched to the phase-separation region above (left) and below (right) the Berghmans’ point.

