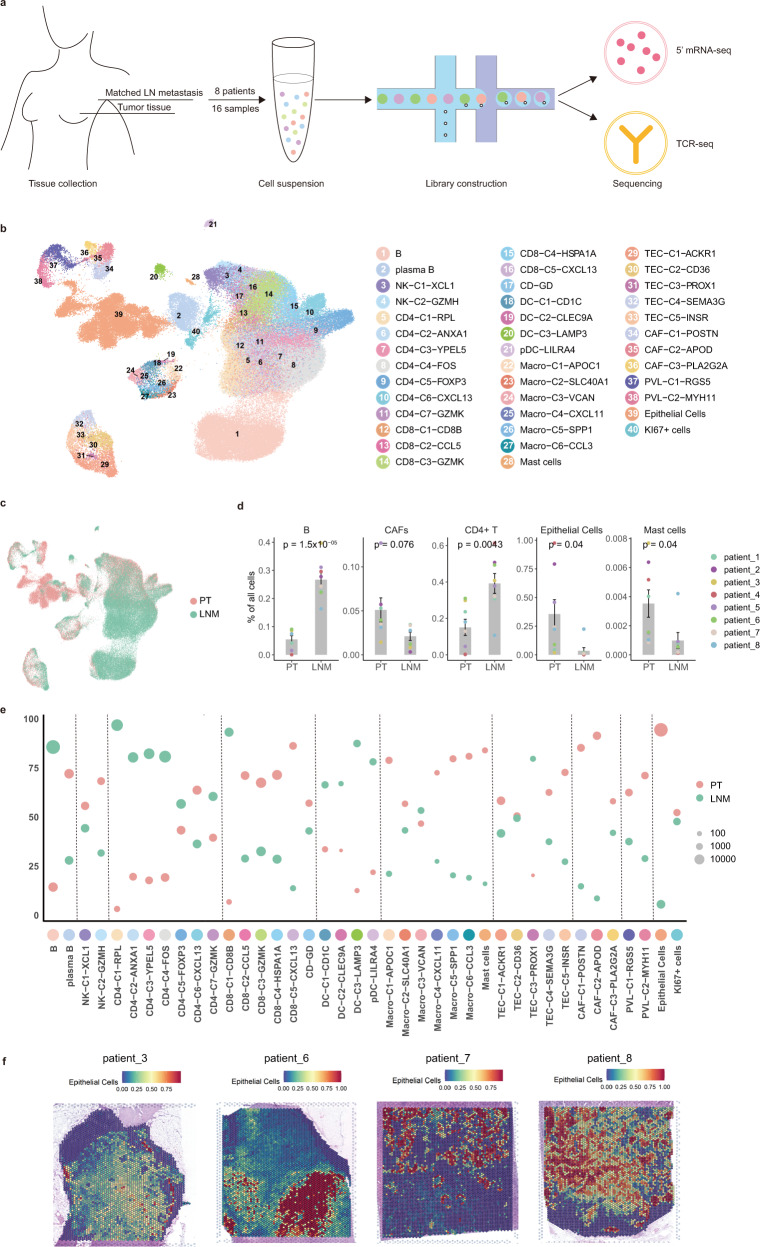
Fig. 1. Microenvironmental landscape of PT and LNMT in breast cancer.
a Diagram of the single-cell sequencing strategy for lymph node metastasis patients. b, c UMAP embedding plot showing identified clusters of all 118845 cells from paired PT (primary tumor) and LNMT (lymph node metastasized tumors) of 8 LNMT patients. Cells were colored according to their clusters (b) or tissues (c). The number of cells per cluster, per patient, and per tissue is summarized in Supplementary data 2. d Bar plots showing the differences in the major cell types between the 2 tissues (PT: n = 8 samples, LNM: n = 8 samples). Statistical testing was performed by a two-sided Wilcoxon test. Data are presented as mean values+/− SD. e The relative proportion of clusters between breast tumor and metastasis lymph node samples. Cell proportion has been normalized by sample size. f Spatial transcriptome analysis revealed the distribution of epithelial cells in the LNMT of 4 patients. Source data are provided as a Source Data file.

