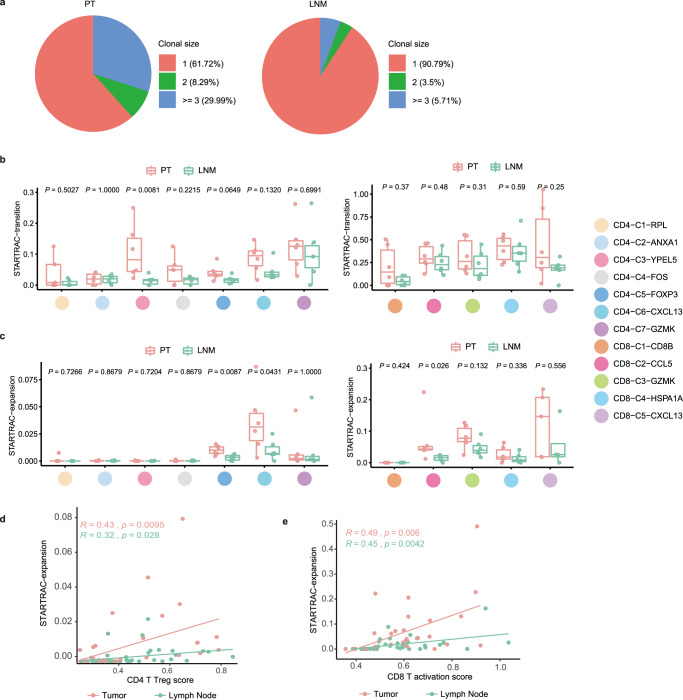
Fig. 3. T cells in PT have higher expansion and transition ability than those in LNMT.
a Pie charts showing the fraction of clonal size of shared clonotypes in tumor (left) or LNMT (right). Red represents unique clonotypes, green represents a clonal size of shared clonotypes of 2, and blue represents the clonal size of shared clonotypes of 3 or above. b Developmental transition of CD4 T clusters (left) and CD8 T clusters (right) quantified by STARTRAC-transition for each patient (n = 6) within each tissue. Two-sided Wilcoxon test. In the box plots, the center line corresponds to the median, box corresponds to the interquartile range (IQR), and whiskers 1.5 × IQR. c Clonal expansion of CD4 T clusters (left) and CD8 T clusters (right) quantified by STARTRAC-expansion for each patient (n = 6) within each tissue. Two-sided Wilcoxon test. In the box plots, the center line corresponds to the median, box corresponds to the interquartile range (IQR), and whiskers 1.5 × IQR. d, e Scatterplot showing the correlation of Tregs score (d) or CD8 activation score (x-axis) (e) with STARTRAC-expansion (y-axis) on CD4 T clusters (d) or CD8 T cell cluster (e) across different tissues. Tregs score and CD8 activation score were calculated with the average expression of corresponding gene list (Supplement data 3). Each dot represents a corresponding cluster for each patient. Pearson correlation coefficient and linear regression were used. Source data are provided as a Source Data file.

