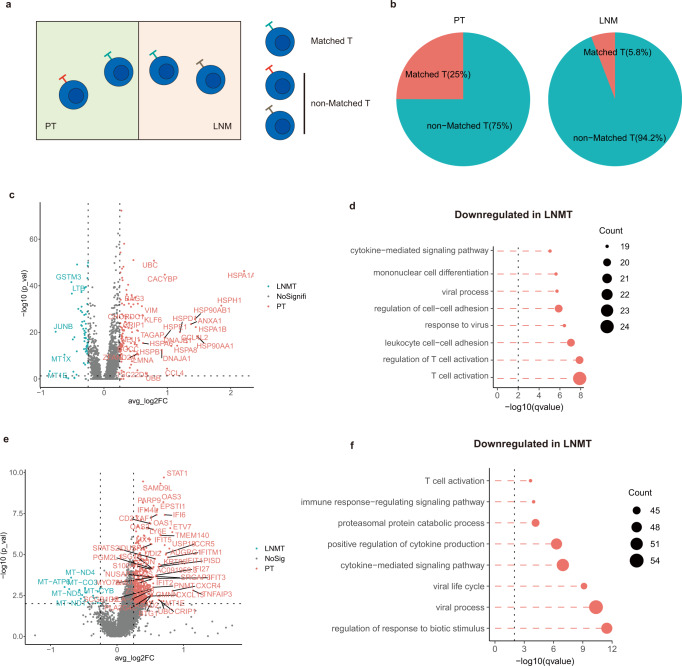
Fig. 4. Characteristics of matched T cells in the breast cancer microenvironment.
a Diagram of matched T and nonmatched T cells. b Pie charts showing the fraction of matched T and nonmatched T cells in PT (left) or LNMT (right). c Volcano plot showing differentially expressed genes between LNMT vs PT for matched CD8 T cells. P value < 0.05, log2 (fold change) ≥ 0.25. Statistical testing was performed by a two-sided Wilcoxon test. d Top 8 enriched pathways for down-regulated genes of matched CD8 T cells in LNMT vs PT. Statistical testing was performed by hypergeometric test. e Volcano plot showing differentially expressed genes between LNMT vs PT for matched Tconvs. P value < 0.05, log2 (fold change) ≥ 0.25. Statistical testing was performed by a two-sided Wilcoxon test. f Top 8 enriched pathways for down-regulated genes in LNMT vs PT. Statistical testing was performed by hypergeometric test. Source data are provided as a Source Data file.

