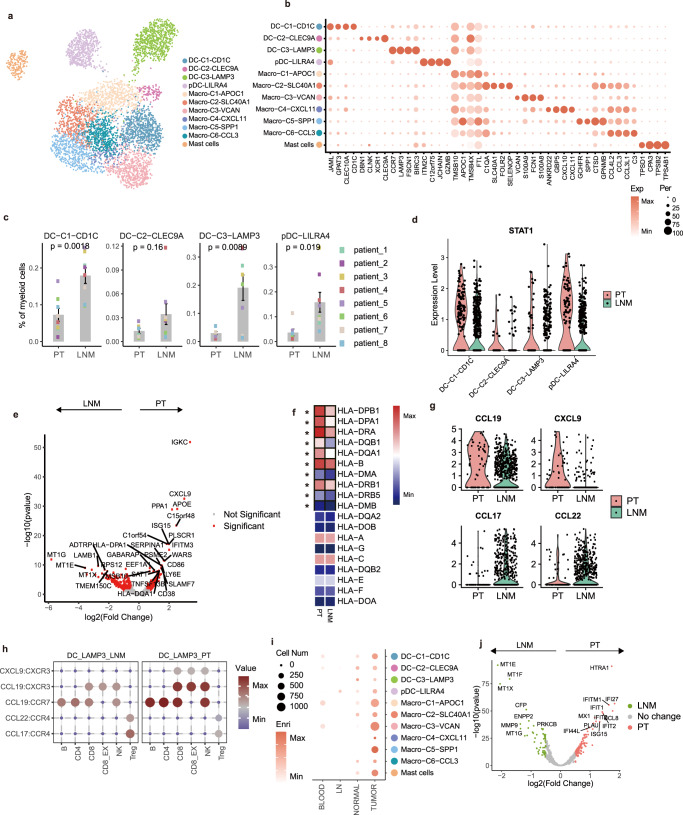
Fig. 5. Characteristics of myeloid cells in the breast cancer microenvironment.
a UMAP embedding plot of 5992 myeloid cells grouped into 11 clusters. b A dot plot showing marker genes across myeloid clusters from the adjacent UMAP embedding plot (a). The dot size indicates the fraction of expressed cells, and the color represents the normalized expression level. c Bar plots showing DC clusters between 2 tissues (PT: n = 8 samples, LNM: n = 8 samples) among myeloid cells. Statistical testing was performed with a two-sided Wilcoxon test. Data are presented as mean values +/− SD. d Violin plots showing the STAT1 expression level of DC clusters. e A volcano plot showing the differentially expressed genes between PT and LNMT in the DC-C3-LAMP3 cluster. P value < .05, log2 (fold change) ≥ 0.5. Statistical testing was performed by a two-sided Wilcoxon test. f A heatmap showing the expression pattern of MHC II genes between PT and LNMT in the DC-C3-LAMP3 cluster. The black board pattern indicates the significance of the unpaired 2-sided t-test. g Violin plots showing the expression of represented chemokines in DC-C3-LAMP3. h Bubble heatmaps show the interaction strength for representative ligand-receptor pairs between LAMP3+ DC and immune cells in different microenvironments; the dot size and color indicate the interaction strength. i A dot plot showing tissue enrichment of myeloid clusters based on GSE114727 dataset12; the dot size indicates the number of cells, and the color represents the enrichment score. j Volcano plot showing the differentially expressed genes between PT and LNMT in macrophages. P value < .05, log2(fold change) ≥ 0.5. Statistical testing was performed by a two-sided Wilcoxon test. The P-values were corrected with Benjamini-Hochberg adjustment. Source data are provided as a Source Data file.

