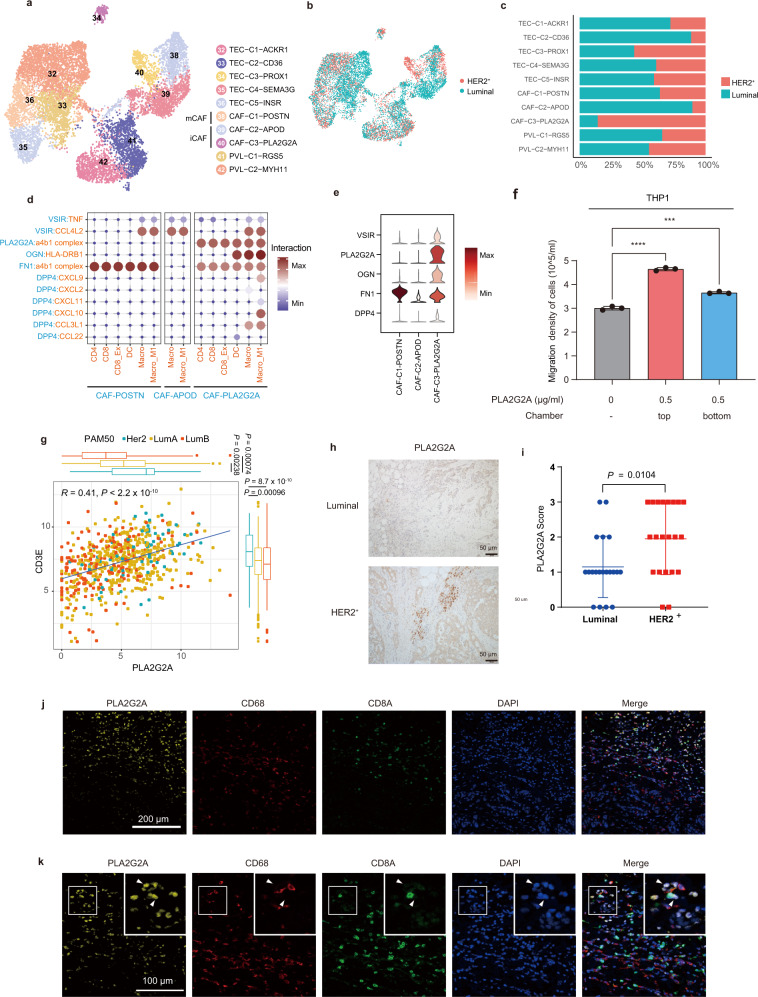
Fig. 6. PLA2G2A+ CAFs in HER2+ breast cancer promoted immune infiltration.
a, b A UMAP embedding plot of 10,049 fibroblasts and vascular endothelial cells grouped into 10 clusters. Cells were color-coded according to cluster (a) or subtypes (b). c The proportion of subtypes within 10 subsets in fibroblasts and vascular endothelial cells; the color represents the tissue type. The x-axis is the fraction of tissues, and the y-axis is the major cell type. d A bubble heatmap showing the interaction strength for representative ligand-receptor pairs between CAFs and immune cells; the dot size and color indicate the interaction strength. e Violin plots showing the expression of proteins that interacted with immune cells of d. f Transwell assays were used to measure cell migration. PLA2G2A protein (0.5 μg/ml) was respectively applied to the top chamber and the bottom chamber, and then cells were incubated at 37 °C in 5% CO2 for 4 h. Statistical testing was performed by two-sided t-test. (n = 3 biological replications; ***P = 0.000706, ****P = 0.000011). Data are presented as mean values+/− SD. g The correlation between PLA2G2A and CD3E of HER2+ and luminal patients in the TCGA-BRCA datasets (HER2+: n = 67 samples, LumA: n = 421 samples, LumB: n = 192 samples). The correlation coefficient and P-value were calculated with two-sided Pearson rank correlation. In the box plots, the center line corresponds to the median, box corresponds to the interquartile range (IQR), and whiskers 1.5 × IQR. Statistical testing was performed with a two-sided Wilcoxon test. h IHC staining showing the PLA2G2A protein levels in representative luminal (left) or HER2+ (right) patients. i PLA2G2A score of IHC either in luminal (n = 20) or HER2+ (n = 21) breast cancer patients. Two-sided Wilcoxon test. Data are presented as mean values+/− SD. j, k Representative images of a HER2+ patient stained by multicolored IHC; yellow represents PLA2G2A+ CAF, red represents macrophages, and the green represents CD8 T cells. Original magnification, 40x (j), scale bar = 200 μm or 100x (k), scale bar = 100 μm. (n = 3 independent replications). Source data are provided as a Source Data file.

