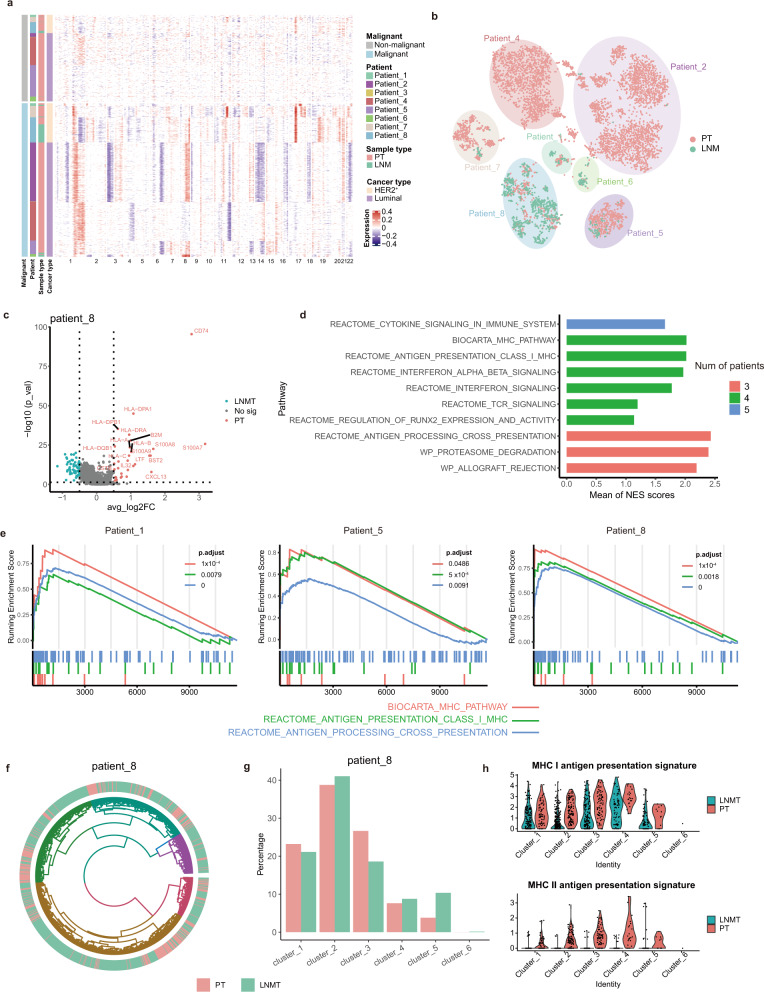
Fig. 7. Antigen-presentation pathway was downregulated in malignant cells of metastatic lymph node.
a A heatmap showing large-scale CNVs of epithelial cells (rows) from paired tumor tissues in 8 LNMT patients. CNVs in red indicate amplifications, while those in blue indicate deletions. CNVs were identified by inferCNV. b t-SNE plot of malignant epithelial cells identified by inferCNV malignant score. c Volcano plot showing the differentially expressed genes between PT and LNMT in malignant cells of patient 8. P value < 0.05, log2 (fold change) ≥ 0.5. Statistical testing was performed by a two-sided Wilcoxon test. d Barplot showing top 10 normalized enrichment score (NES) of shared significant enriched pathways across patients. Genes ranks calculated by PT vs LNMT in malignant cells for each patient were used for NES calculating by GSEA analysis. Color represents the numbers of patients which are significant in same pathways. e GSEA analysis showed that genes rank in PT vs LNMT of represented patients are enriched in antigen presentation pathway. Left represent high gene rank in PT. Statistical testing was performed by permutation test. The P-values were corrected with Benjamini-Hochberg adjustment. f Circos plots showing 6 CNV clusters of malignant epithelial cells according to CNVs similarity for patient 8. Cells were colored by tissue. g Bar plot showing the frequency of 6 CNV clusters in patient 8. h Violin plots showing the MHC I antigen presentation signature (Up) and MHC II antigen presentation signature (Down) of 6 CNV clusters from patient 8. Source data are provided as a Source Data file.

