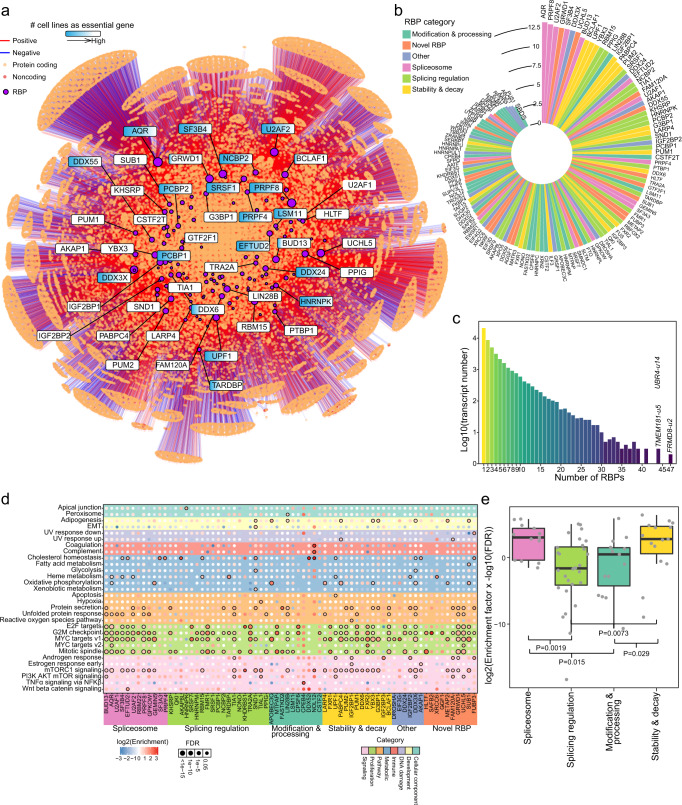
Fig. 3. The regulation of transcripts by RBPs.
a The regulatory network of RBPs and transcripts. b The numbers of regulated transcripts for each RBP. c The numbers of transcripts regulated by different numbers of RBPs. d The bubble plot shows the enrichment of regulated transcripts in biological hallmarks across different RBPs. Bubbles with FDR values <0.05 are labeled with black borders. e Comparisons of enrichment among different categories of RBPs (n = 13 RBPs for “spliceosome” category, n = 28 for “splicing regulation” category, n = 15 “modification & processing” category, n = 15 for “stability & decay” category). Each box represents the IQR and median of enrichment scores for each category, whiskers indicate 1.5 times IQR. P, two-sided Wilcoxon’s rank-sum test p-value.

