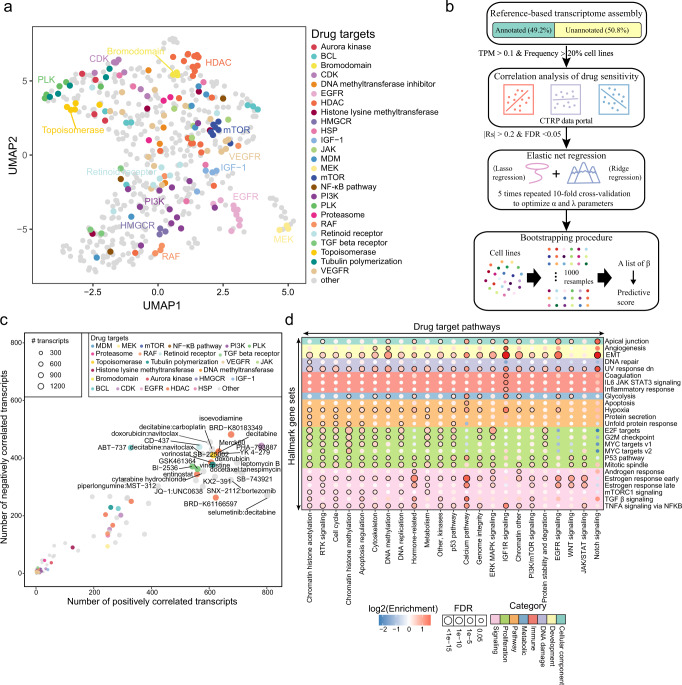
Fig. 4. Associations between transcript expression and anti-cancer drug sensitivity.
a UMAP shows the drug groups clustered by associated transcripts. b Workflow of identifying drug-associated transcripts based on a machine learning model. c The scatterplot shows the numbers of positively and negatively associated transcripts for each anti-cancer drug (predictive score ≥ 0.7). d The bubble plot presents the enrichment of transcripts in hallmarks across different categories of anti-cancer drugs. The X axis represents drug target pathways, and the Y axis represents hallmark gene sets. Bubbles with FDR <0.05 are labeled with black borders.

