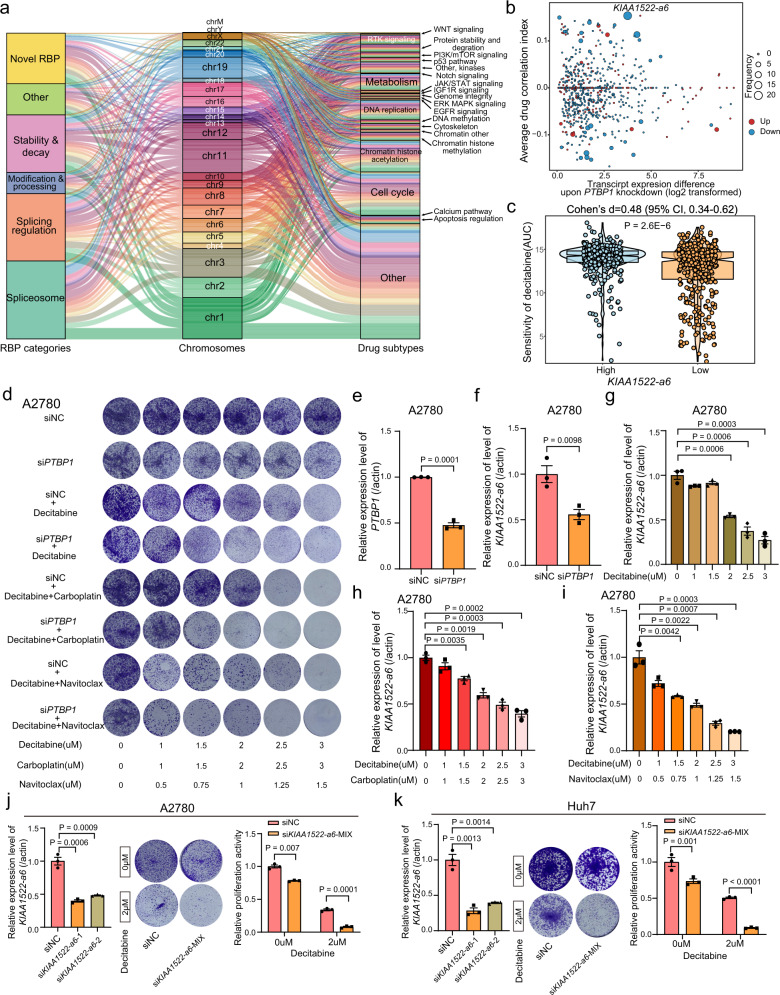
Fig. 5. RBP-transcript-drug regulatory axes in cancer.
a Sankey diagram showing the RBP-transcript-drug regulatory axes in cancer. b Drug correlations of differentially expressed transcripts upon the knockdown of PTBP1. c Comparison of decitabine sensitivity between KIAA1522-a6 high and low expression cancer cell lines (n = 392 for high expression cell lines, n = 393 for low expression cell lines). Each box represents the IQR and median of AUC values for each cell group, whiskers indicate 1.5 times IQR. P, two-sided Wilcoxon’s rank-sum test. d Crystal violet staining of the colony formation assay indicates the sensitivity of siNC-transfected or siPTBP1-transfected cells to decitabine, decitabine combined with carboplatin, or decitabine combined with navitoclax. The effect of treatments is shown for A2780 cells. qRT-PCR assays were applied to analyse the expression level of PTBP1 (e) and KIAA1522-a6 (f) after transfection by siPTBP1 for 48 h in A2780 cells. qRT-PCR assays were applied to analyze the expression level of KIAA1522-a6 in A2780 cells treated with Decitabine (g), Decitabine combined with Carboplatin (h), and Decitabine combined with Navitoclax (i). The relative expression of KIAA1522-a6 upon siKIAA1522-a6-1 and siKIAA1522-a6-2 transfection and the relative proliferation activity upon siKIAA1522-a6-MIX and decitabine treatment in the A2780 cell line (j) and the Huh7 cell line (k). SiKIAA1522-a6-MIX is the mixture of siKIAA1522-a6-1 and siKIAA1522-a6-2. P, two-sided Student’s t test p-value. n = 3 biologically independent samples. Error bars represent the means ± SDs.

