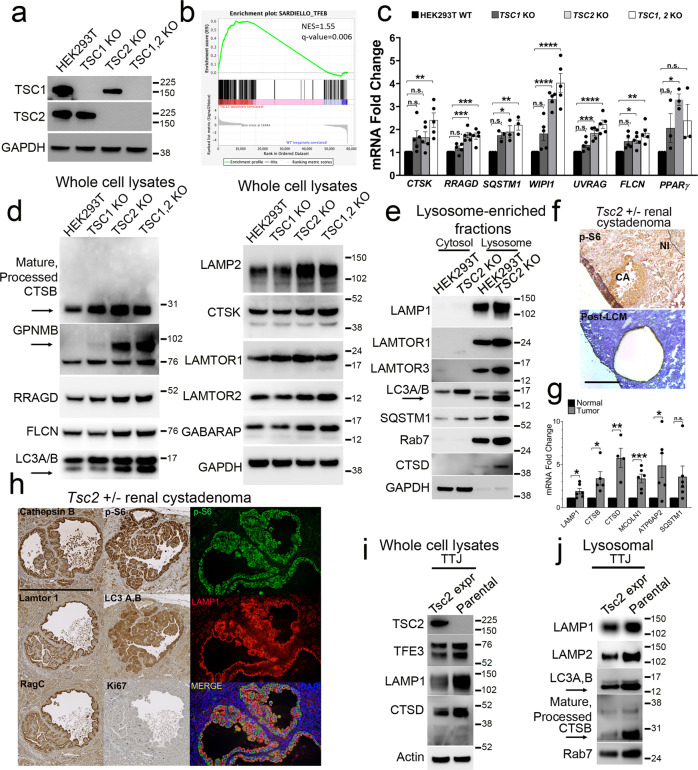
Fig. 1. mTORC1 hyperactivation via TSC2 loss drives lysosomal biogenesis in murine and human renal tumor cells.
a Immunoblotting of HEK293T WT cells and cells with CRISPR-Cas9-mediated genomic deletion of TSC1, TSC2, and TSC1/2. b Gene Set Enrichment Analysis (GSEA) comparing TSC1/2 KO versus WT cells for TFEB transcriptional targets31. c Quantitative real-time PCR (qRT-PCR) for lysosomal CLEAR target gene transcripts in TSC1, TSC2, and TSC1/2 KO cells compared to WT controls. n = 3 (SQSTM1, PPARγ) and 5 (CTSK, RRAGD, WIPI1, UVRAG, FLCN) independent biological replicates. Graphs are presented as mean values ± SEM. Statistical analyses were performed using one-way ANOVA with Dunnett’s test for multiple comparisons. *p < 0.05, **p < 0.01, ***p < 0.001, ****p < 0.0001 (also see Fig. S1a). Immunoblotting for lysosomal proteins in: d whole-cell lysates of TSC1, TSC2, and TSC1/2 KO cells compared to WT controls and e lysosomal fractionation assays of TSC2 KO cells, compared to WT cells. Arrows in d indicate increased mature, processed Cathepsin B and a specific band for GPNMB and arrows in d, e indicates lipidated LC3-II accumulation in TSC2 KO cells. f Representative tumor sections immunostained for p-S6 (top) and hematoxylin-stained slides following laser-capture microdissection of murine Tsc2 ± renal cystadenomas (bottom) (Scale bar = 500 μm). g qRT-PCR from micro-dissected tumor samples in f for lysosomal genes compared to matched normal kidney. n = 4 (CTSD), 5 (CTSB), and 6 (LAMP1, MCOLN1, ATP6AP2, and SQSTM1) independent biological replicates. Graphs are presented as mean values ± SEM. Statistical analyses were performed using two-tailed Students t-test. *p < 0.05, **p < 0.01, ***p < 0.001. h Immunostaining of Tsc2 ± renal cystadenomas for lysosomal proteins. (Scale bar = 1 mm). Immunoblotting of Tsc2−/− TTJ cells for lysosomal proteins in i whole-cell lysates and j lysosomal fractions compared to TTJ cells with Tsc2 re-expression. Processed CTSB (arrow) and LC3-II (arrows) are indicated. Source data are provided as a Source Data file.

