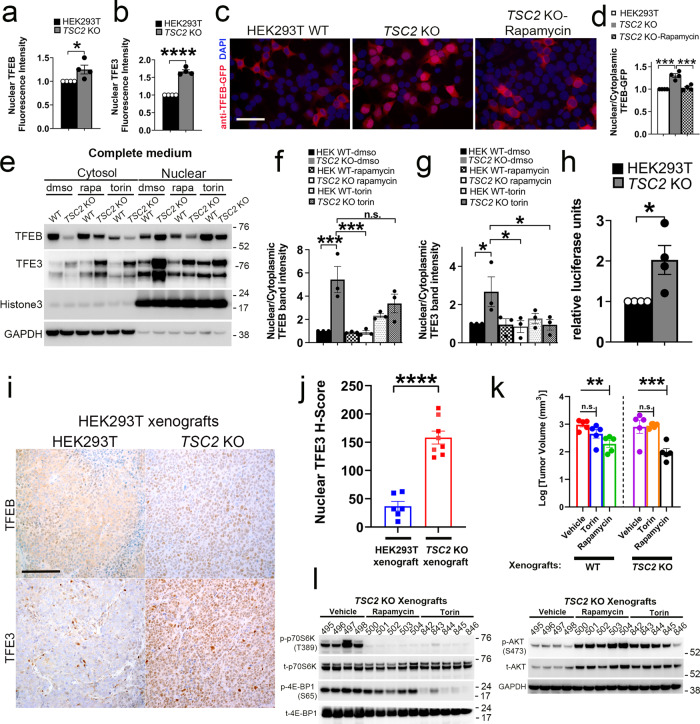
Fig. 2. MiT/TFE nuclear localization and transcriptional activity is increased in vitro with TSC2 loss.
Indirect immunofluorescence quantification for TFEB (a), and TFE3 (b) in TSC2 KO cells compared to WT controls (from experiments in Fig. S2a and S2b, respectively). n = 4 independent biological replicates, counting 2565 cells (for TFE3) and 780 cells (for TFEB), per replicate. p = 0.0369 for TFEB and p < 0.0001 for TFE3. c Indirect immunofluorescence for GFP in WT and TSC2 KO cells transiently transfected with TFEB-GFP for 24 h ± rapamycin (200 nM, 2 h) (Scale bar = 100 µm). d Quantification of nuclear/cytoplasmic TFEB-GFP fluorescence from experiments in c. n = 4 independent biological replicates, counting 150 cells per replicate. p = 0.0001 (WT vs TSC2 KO) and p = 0.0002 (TSC2 KO ± rapamycin). e TFEB and TFE3 expression in nuclear-fraction immunoblots of TSC2 KO cells compared to WT controls ± rapamycin (200 nM, 2 h) or torin (1 µM, 2 h). f, g Densitometry quantification of immune-blot experiments from e. n = 3 independent biological replicates. *p < 0.05, ***p < 0.001. h 4X-CLEAR luciferase activity in TSC2 KO cells compared to WT controls, normalized to Renilla luciferase. n = 4 independent biological replicates. p = 0.0282. i Representative TFEB and TFE3 immunohistochemistry images for TSC2 KO xenografts in NSG mice, compared to WT xenografts (Scale bar = 200 µm). j Digital quantification of mean nuclear TFE3 H-score from experiments in i. n = 6 (WT xenografts) and 8 (TSC2 KO xenografts) independent biological replicates. p < 0.0001. k In vivo growth and tumor volume of subcutaneous WT and TSC2 KO xenografts in NSG mice treated with vehicle, rapamycin or torin. n = 5 independent biological replicates. p = 0.0092 (rapamycin; WT xenografts) and p = 0.0005 (rapamycin; TSC2 KO xenografts). l Immunoblotting of tumor lysates from TSC2 KO xenografts (from experiments in k) treated with vehicle, rapamycin or torin (also see Fig. S3b). All graphs are presented as mean values ± SEM. Statistical analyses were performed using two-tailed Students t-test (panels a, b, h, and j) or one-way ANOVA with Dunnett’s test for multiple comparisons (panels d, f, and g) or Bonferroni’s test for multiple comparisons (panel k), if more than 2 groups. Source data are provided as a Source Data file.

