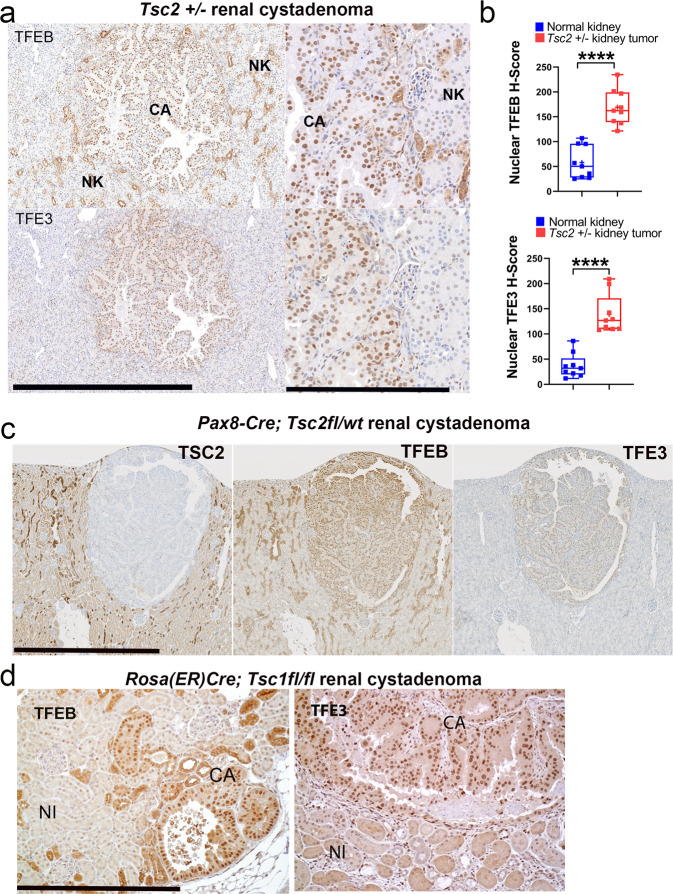
Fig. 3. TFEB and TFE3 have increased nuclear localization in murine renal tumors associated with TSC2 loss in vivo compared to normal kidney.
a Representative immunohistochemistry (IHC) for TFEB (top row) and TFE3 (bottom row) in Tsc2 ± murine renal cystadenomas (CA), compared to surrounding normal kidney (NK) (Scale bar = 1 mm; inset = 250 µm). b Digital quantification of mean nuclear TFEB and TFE3 H-scores from experiments in a, as depicted by box-and-whisker plots. All box plots include the central median line, “+” at the mean, the box denoting the interquartile range (IQR; extending from 25th to 75th percentile) with whiskers plotted down to the minimum and up to the maximum values. n = 9 independent biological replicates. Statistical analyses were performed using two-tailed Students t-test. p < 0.0001 (for TFEB and TFE3). c Representative IHC for TSC2 (left), TFEB (middle), and TFE3 (right) in renal cystadenomas from Pax8 Cre; Tsc2fl/wt mice at 18 months (Scale bar = 1 mm). d Representative IHC for TFEB (left) and TFE3 (right) in Tsc1−/− renal cystadenomas from Rosa(ER)Cre;Tsc1fl/fl mice treated with 4-OHT (Scale bar = 250 µm). Source data are provided as a Source Data file.

