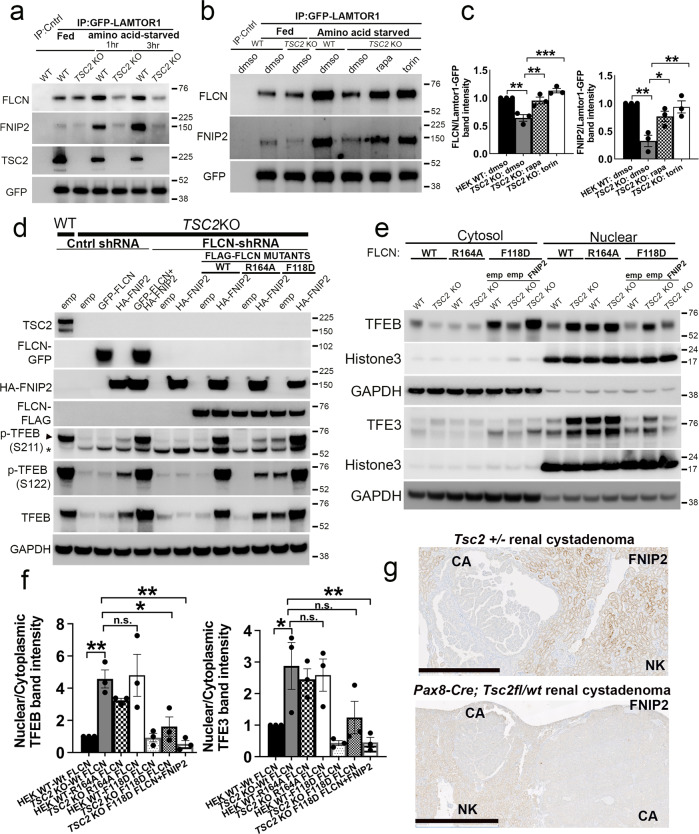
Fig. 7. Restoration of FLCN:FNIP2 lysosomal localization by mTORC1 inhibition or co-expression of FLCN and FNIP2 fully rescues TFEB phosphorylation in cells with TSC2 loss.
a WT and TSC2 KO cells were transiently transfected with Lamtor1-GFP for 24 h, and maintained in complete growth media (fed) or amino-acid-starved for 1 or 3 h, followed by immunoprecipitation (IP) with a binding control or a GFP-Trap coupled to magnetic agarose beads and immunoblotting. b WT and TSC2 KO cells were transiently transfected with Lamtor1-GFP for 24 h. The indicated cells were then treated with dmso (vehicle), rapamycin (200 nM), or torin (1 µM) for 1 hr in complete growth media and amino-acid-starved for 1 h, prior to lysis and immunoprecipitation (IP) with either a binding control or a GFP-Trap coupled to magnetic agarose beads and immunoblotting (also see Fig. S9c). c Densitometry quantification of normalized FLCN or FNIP2 band intensities from immunoblot experiments in amino-acid-starved samples shown in b. n = 3 independent biological replicates. d WT and TSC2 KO control shRNA-expressing cells were transiently transfected with empty vector, GFP-FLCN, HA-FNIP2 or both GFP-FLCN and HA-FNIP2 for 24 h, as indicated (lanes 1–5). In the same experiment, FLCN-depleted TSC2 KO cells, stably expressing FLAG-tagged, WT FLCN (lanes 8–9), FLCNR164A (lanes 10–11), or FLCNF118D (lanes 12–13) mutants were transiently transfected with either empty vector or HA-FNIP2 for 24 h followed by lysis and immunoblotting (also see Fig. S9a). e TFEB and TFE3 expression in nuclear-fraction immunoblots of FLCN-depleted, WT and TSC2 KO cells stably expressing FLAG-tagged, WT FLCN, FLCNR164A, or FLCNF118D mutants. In the same experiment, the FLCNF118D cells were transiently transfected with empty vector or HA-FNIP2, prior to fractionation, lysis and immunoblotting. f Densitometry quantification of representative immunoblot experiments from e. n = 3 independent biological replicates. g Representative IHC for FNIP2 in murine renal cystadenomas (CA), compared to surrounding normal kidney (NK) in Tsc2 ± mice (top panel; scale bar = 1 mm) and Pax8 Cre; Tsc2fl/wt mice (bottom panel; scale bar = 2 mm). All graphs are presented as mean values + SEM. Statistical analyses were performed using one-way ANOVA with Dunnett’s test for multiple comparisons. *p < 0.05, **p < 0.01, ***p < 0.001. Source data are provided as a Source Data file.

