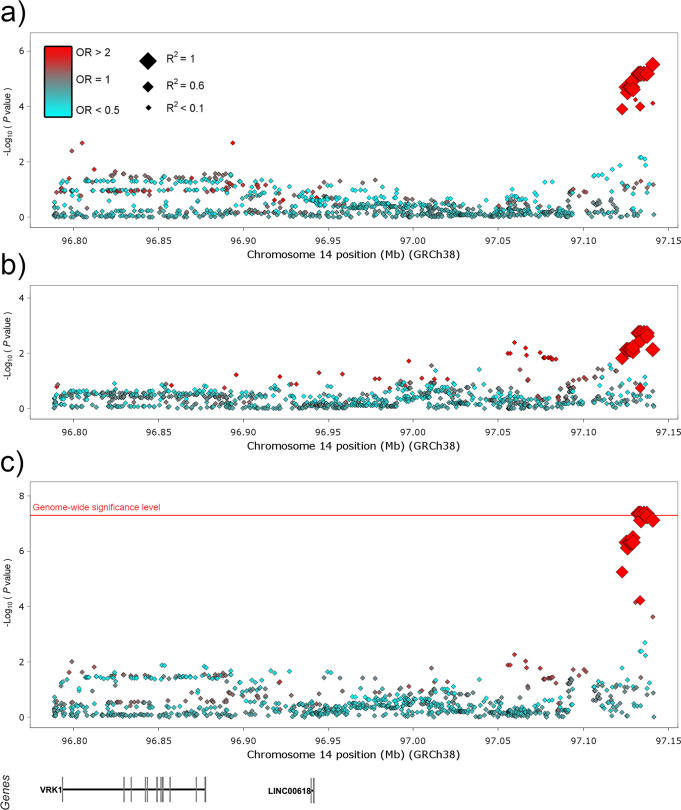
Fig. 3. Manhattan plot representation of the logistic regression test for the VKR1 region accordingly with Sertoli cell-only phenotype.
Data for the Iberian discovery cohort (a), the German replication cohort (b), and the combined cohort (c) are shown. The −log10 of the P-values from the logistic regression tests and the inverse variance method are plotted against their physical chromosomal position. A red/blue colour gradient was used to represent the effect size of each analysed variant (red for risk and blue for protection). The red line represents the genome-wide level of significance (P < 5E−08).

