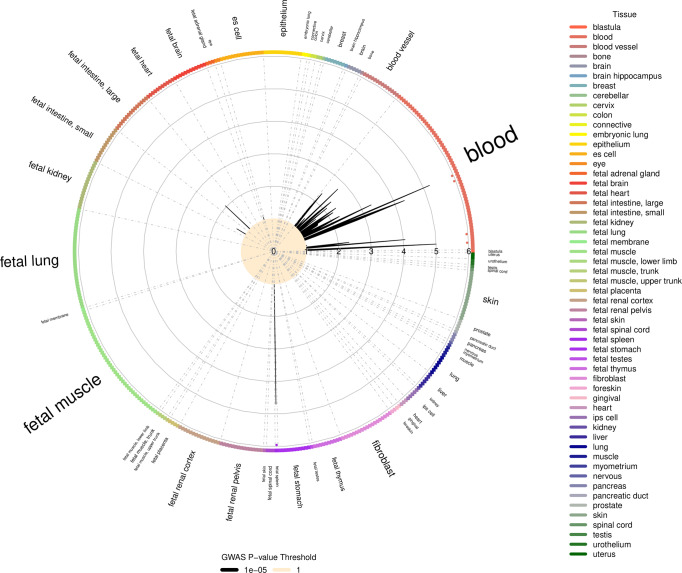
Fig. 4. GARFIELD functional enrichment analysis of the GWAS results accordingly with Sertoli cell-only phenotype.
The radial axis represents the enrichment (OR) for each of the analysed cell types that are sorted by tissue along the outside edge of the plot. Boxes forming the edge are coloured by tissue. Enrichment is calculated for the GWAS P-value threshold P < 1E−05. Dots in the inner ring of the outer circle denote significant GARFIELD enrichment after multiple-testing correction for the number of effective annotations and are coloured with respect to the tissue cell type tested (font size of tissue labels reflects the number of cell types from that tissue).

