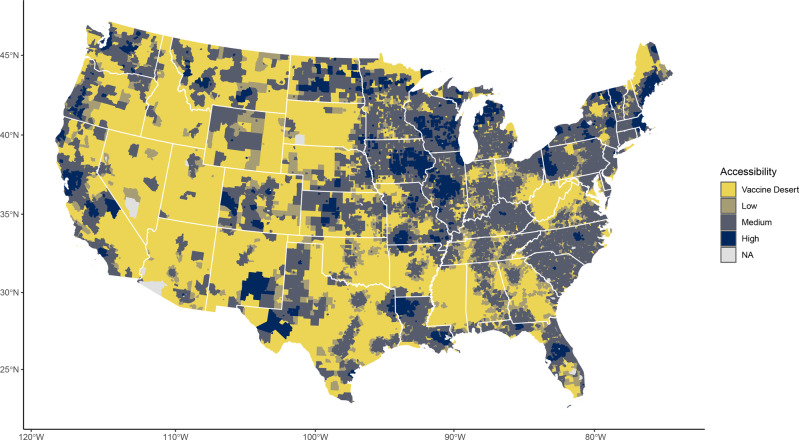
Fig. 3. COVID-19 vaccine deserts and accessibility scores across the US.
Map of United States Census tracts colored by their spatial accessibility to COVID-19 vaccine doses. Accessibility scores (Ai) were estimated by the enhanced two-step floating catchment area method. Access strata broadly represent cutoffs suggesting difficulty in reaching herd immunity in 8-months (Jan 1—American Labor Day) with one dose (vaccine desert, Ai < 0.85), immunizing all with one dose (low, 0.85 ≤ Ai < 1.0), difficulty immunizing all with two doses (medium, 1.0 ≤ Ai < 2.0), and sufficient accessibility (high, Ai ≥ 2.0). Under the modeled distribution scheme, if the vaccine sites available to each census tract have a steady supply for the rollout period, they would have a sum (accounting for travel-time decay) of Ai doses per person in their respective weighted catchment areas. No estimates (NA) were provided for non-populated census tracts and those (n = 23) where Ai was undefined.

