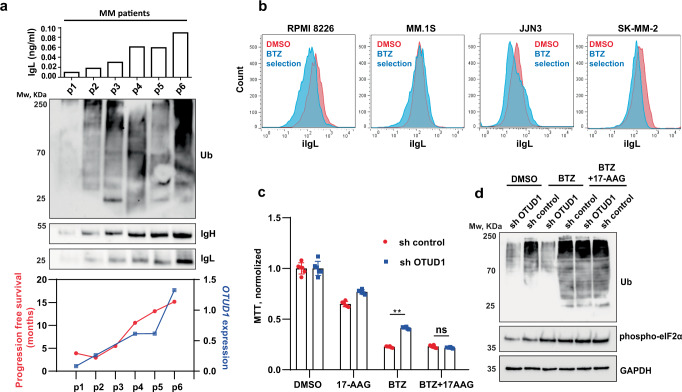
Fig. 7. Inhibition of HSP90 overcomes PIs resistance in OTUD1 low myeloma.
a IgL concentration in aberrant plasma cells isolated using specific myeloma panel from newly diagnosed MM patients (n = 6) was quantified by ELISA (top graph). Levels of total ubiquitin, IgL, and IgH were detected by immunoblotting in primary cell extracts (western blot). Expression of OTUD1 in primary cells was analyzed by RT-PCR and plotted together with progression-free survival (PFS) (bottom graph). All 6 patients (p1-p6) received bortezomib (BTZ)-based treatment in the first line of therapy. b 106 MM cells were treated with 10 nM BTZ or DMSO as control. After 16 h cells were washed with PBS and transferred into fresh media without BTZ. Seventy-two hours later cells were stained with Annexin-V and viable cells were stained with LIVE/DEAD Fixable Blue Dead Cell Stain Kit (Invitrogen). Cells were fixed and permeabilized using FIX & PERM Cell Permeabilization Kit (Invitrogen) and labeled with Lambda-APC-C750™ (Cytognos) antibody. 104 events were collected in the LIVE/DEAD negative gate. c RPMI8226 cells stably expressing non-mammalian control shRNA or shRNA targeting OTUD1 were exposed to vehicle (DMSO), 10 nM BTZ, 250 nM 17-AAG alone or 10 nM BTZ together with 250 nM 17-AAG for 16 h, and viability was assessed using MTT assay. Significance was compared using the two-tailed Student’s t-test (BTZ p < 0.0001, BTZ + 17-AAG p = 0.0669), ns non-significant. Data are represented the mean ± SD from 6 biological replicates. d The amount of total ubiquitinated proteins in whole cell lysates from RPMI8226 cells used in (c) was determined by western blotting (upper part) and the relative band intensities were quantified using ImageJ software and normalized to GAPDH loading control (bottom part).

