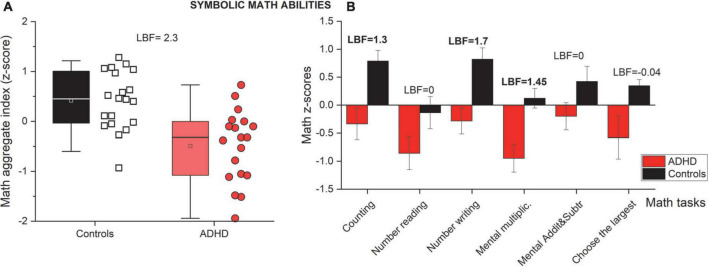
FIGURE 2.
Mathematical abilities. (A) Whisker plots reporting mathematical abilities as an aggregate index (average z-score across six math tests). Color and Whisker conventions as before. (B) Participants’ average math scores divided into the six different math tests for controls (black) and ADHD groups (red). Error bars report ± 1 s.e.m. Strong evidence (LBF > 1) in favor of the alternative hypothesis (difference between groups) are indicated in bold.

