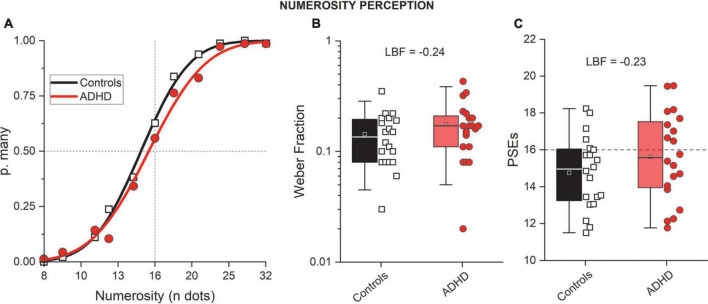
FIGURE 4.
Numerosity perception. (A) Psychometric functions (aggregate data) reporting the probability of “many” (p. many) responses as a function of the test numerosity divided for controls (black, squares) and participants with ADHD (red, circles). (B,C) Whisker plots reporting numerosity thresholds (Weber fractions, B) and accuracy (PSEs, C). Color conventions as before. Whisker parameters. Box: 25–75 percentiles; Whisker: 5–95 percentiles; Line: average; Square: median.

