Figure 2.

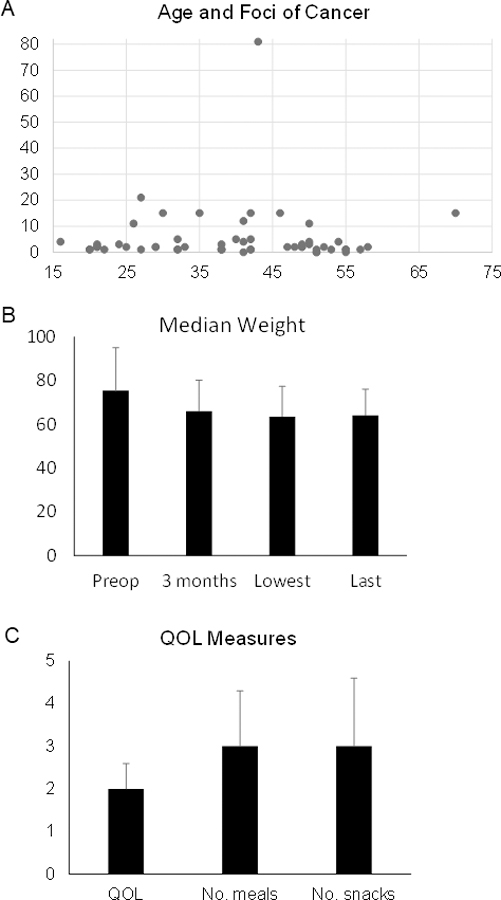
A. Graph showing patient age and number of foci of cancer. B. Graph showing median weight of patients at various time points. C. Graph showing QOL measure. Bars represent standard deviation.

A. Graph showing patient age and number of foci of cancer. B. Graph showing median weight of patients at various time points. C. Graph showing QOL measure. Bars represent standard deviation.