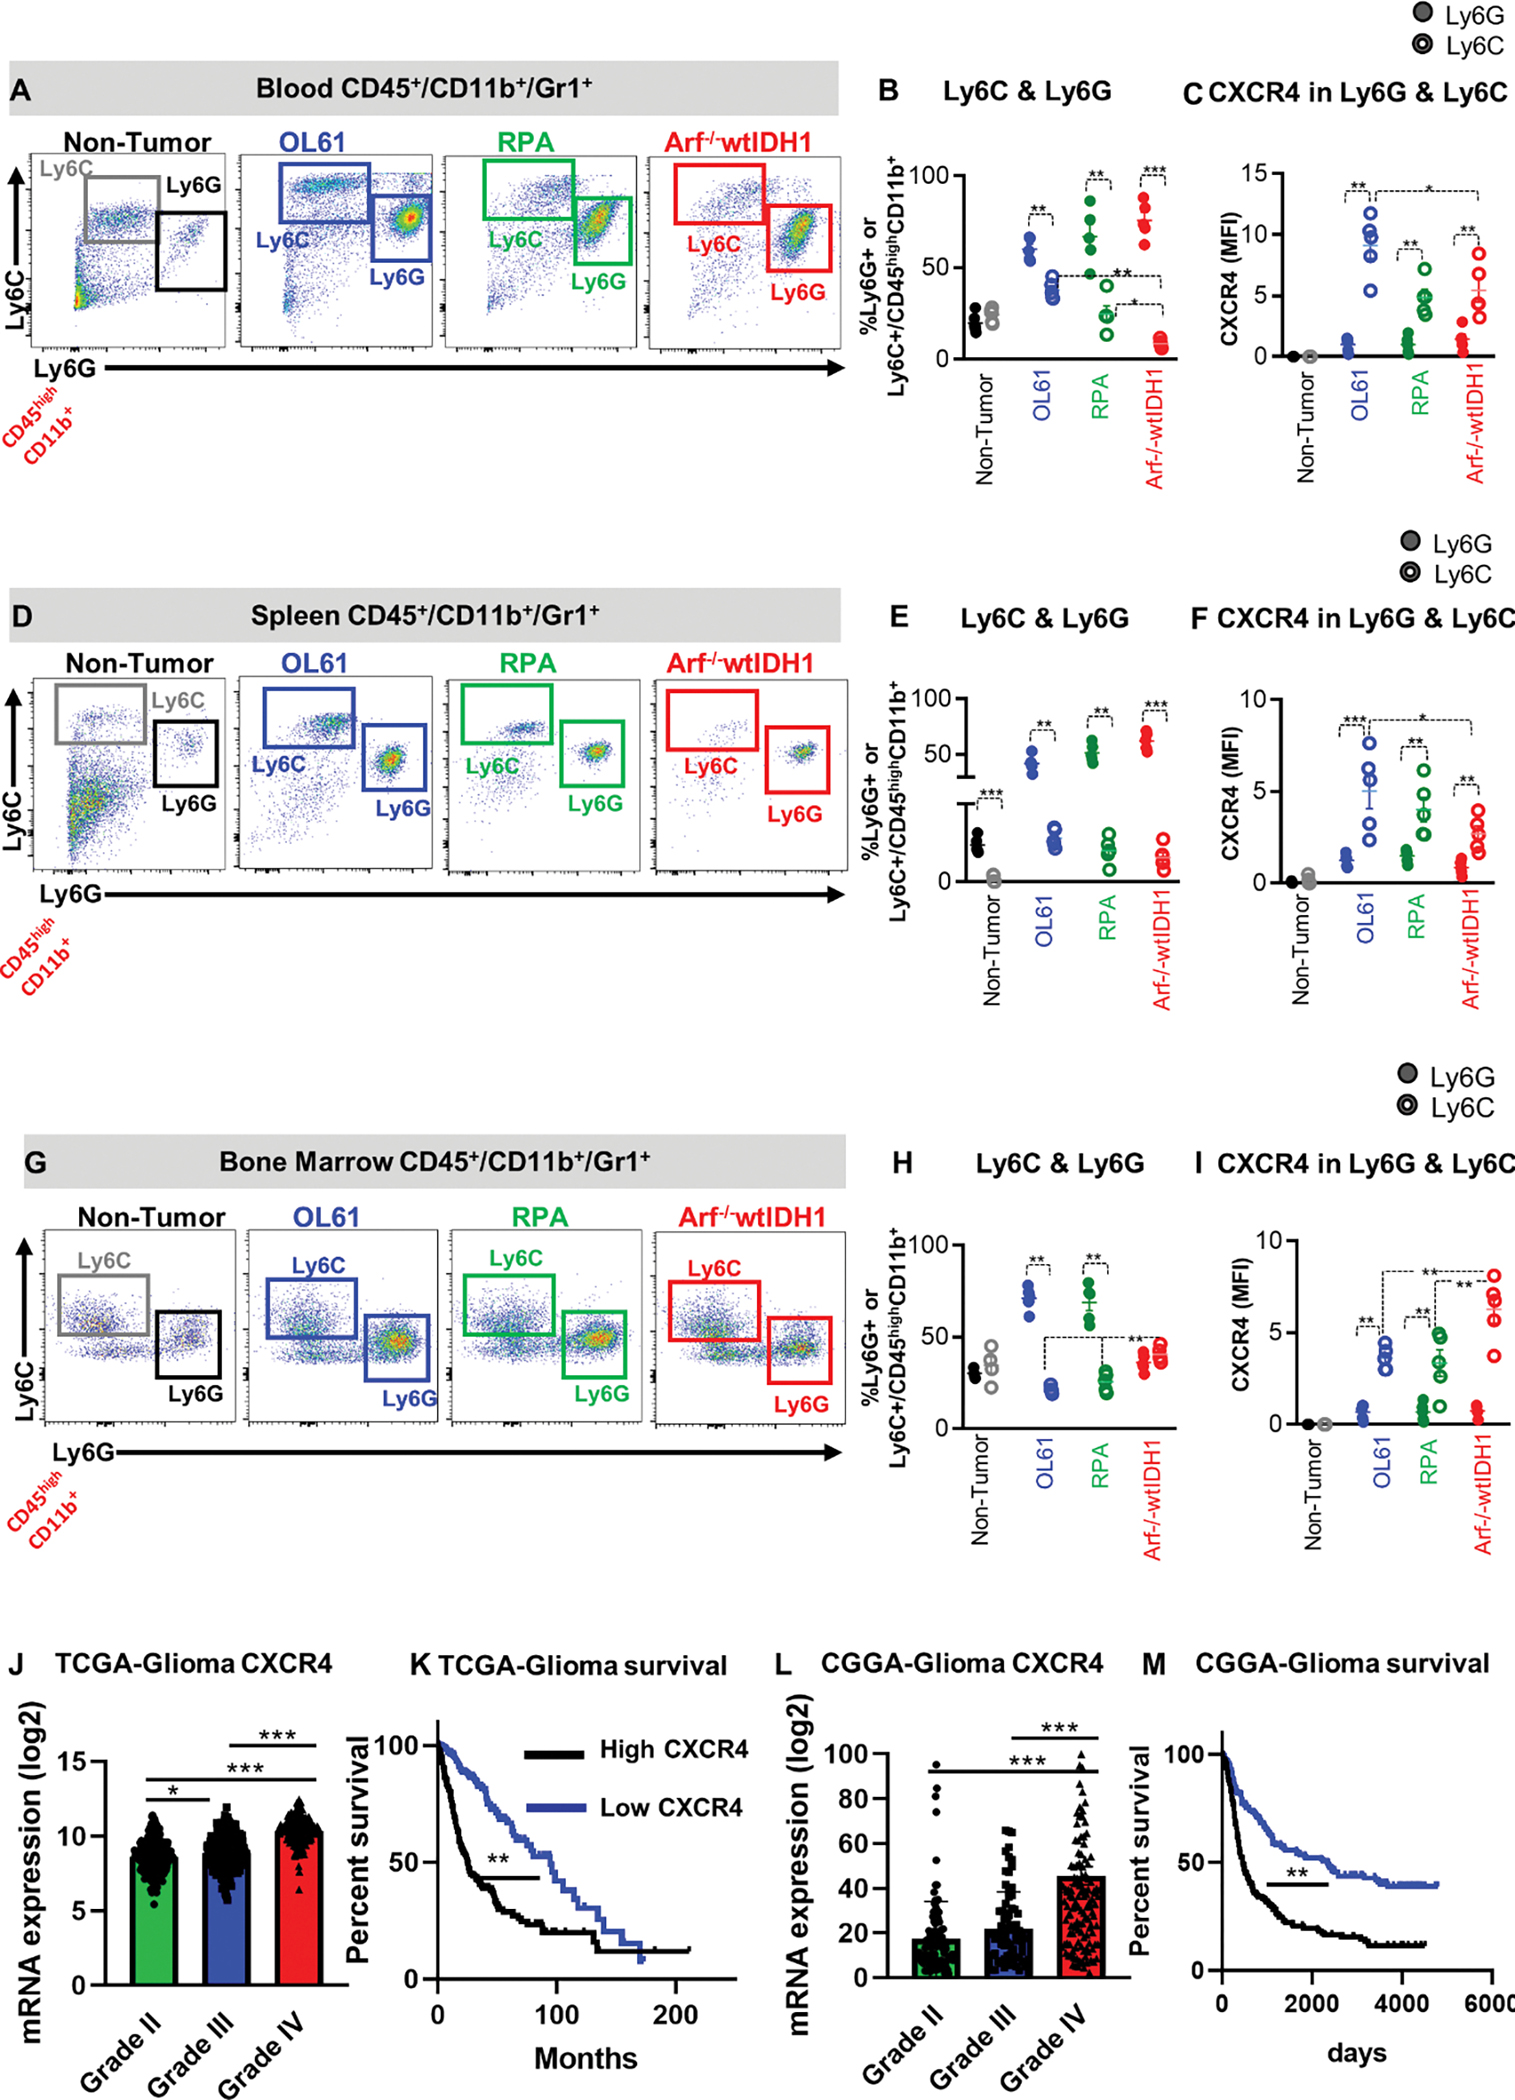
Figure 2. CXCR4 is expressed primarily by monocytic MDSCs (CD45high/CD11b+/Ly6Chigh) and is associated with poor prognosis.

(A, B) Representative flow cytometry plots and quantification of the percentage of PMN-MDSCs (CD45high/CD11b+/Ly6G+/Ly6Clow) or M-MDSCs (CD45high/CD11b+/ Ly6Chigh) in bone marrow (BM) from normal mice (N), and mice implanted with OL61, RPA, or Arf−/− wtIDH1 neurospheres. (C) Quantitative analysis of CXCR4 expression in conditions from (B). (D, E) Representative flow cytometry plots and quantification of the percentage of PMN-MDSCs (CD45high/CD11b+/Ly6G+/Ly6Clow) or M-MDSCs (CD45high/CD11b+/ Ly6Chigh) in blood from normal mice (N), and mice implanted with OL61, RPA, or Arf−/− wtIDH1 neurospheres. (F) Quantitative analysis of CXCR4 expression in conditions from (E). (G, H) Representative flow cytometry plots and quantification of the percentage of PMN-MDSCs (CD45high/CD11b+/Ly6G+/Ly6Clow) or M-MDSCs (CD45high/CD11b+/ Ly6Chigh) in spleen from normal mice (N), and mice implanted with OL61, RPA, or Arf−/− wtIDH1 neurospheres. (I) Quantitative analysis of CXCR4 expression in conditions from (H). (J) Analysis of CXCR4 gene expression for glioma patients according to their grade, Grade II (n=226), Grade III (n= 244), and Grade IV (n=150). (K) Kaplan-Meier survival analysis of TCGA glioma patients with high vs low level of CXCR4 expression. (L) Analysis of CXCR4 gene expression for glioma patients in CGGA database according to their grade, Grade II (n=103), Grade III (n= 79), and Grade IV (n=139). (M) Kaplan-Meier survival analysis of CGGA glioma patients with high vs low level of CXCR4 expression. * p<0.05, ** p<0.01, *** p<0.005, One-way ANOVA, (n=5/group).
