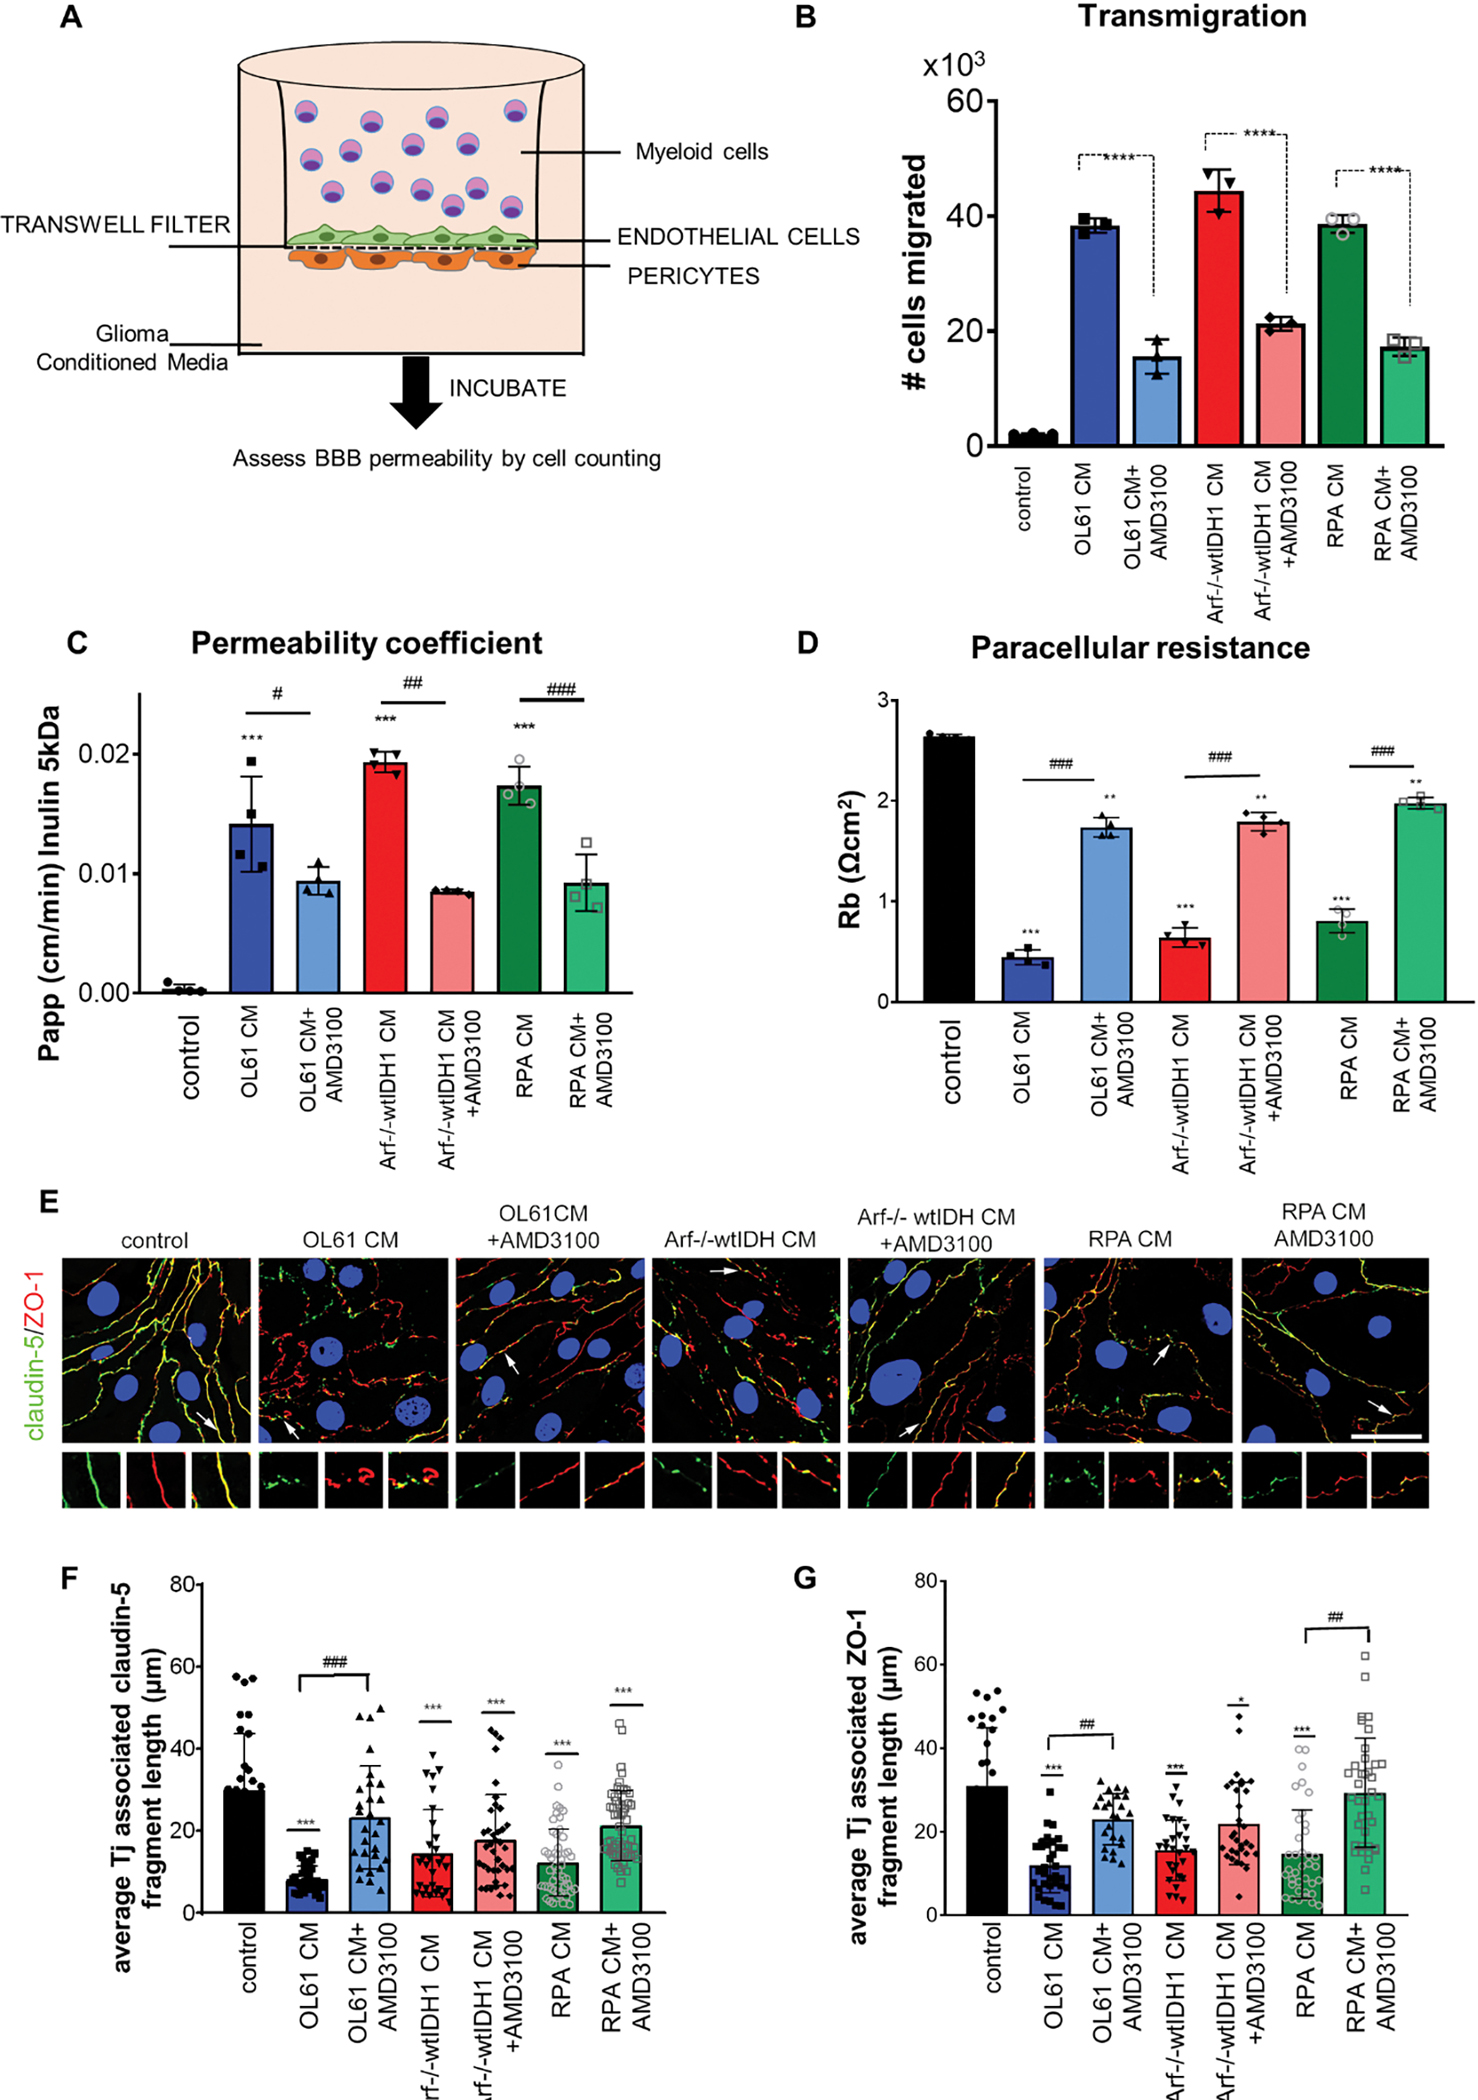
Figure 3. CXCR4 signaling enhances myeloid cells transmigration and increases brain endothelial cell (BEC) barrier permeability.

(A) Diagram of transwell dual-chamber system used for cell migration assay. (B) Bar graph represents the number of the myeloid cells migrated through the endothelial-pericytes transmembrane. (C) Permeability coefficient (Papp) for FITC-inulin in mBMEC monolayers exposed to condition media collected from OL61, Arf−/−wtIDH and RPA cells with or without CXCR4 inhibitor AMD3100 for 24 hrs. (D) Bar graph represents paracellular resistance (Rb) value at 24 hrs for all analyzed groups. (E) Immunofluorescence staining for tight junction (Tj) proteins claudin-5 and ZO-1 in control and cells exposed to OL61, OL61+AMD3100, Arf−/−wtIDH, Arf−/−wtIDH+AMD3100, and RPA and RPA+AMD3100 for 24 hrs. Arrow and magnified images indicate pattern and colocalization of claudin-5 and ZO-1 on the cell border. Scale bar 50mm. Quantitation of the average TJ-associated (F) claudin-5 and (G) ZO-1 fragment length in claudin-5/ZO-1 costained immunofluorescent images in control and cells exposed to OL61, OL61+AMD3100, Arf−/−wtIDH, Arf−/−wtIDH+AMD3100, and RPA and RPA+AMD3100 for 24 hrs. Data are shown as means ± SD. n = 3–5; ***p<0.0001 and **p<0.001 comparing to control. ###p<0.0001 comparing experimental groups with and without inhibitor AMD3100.
