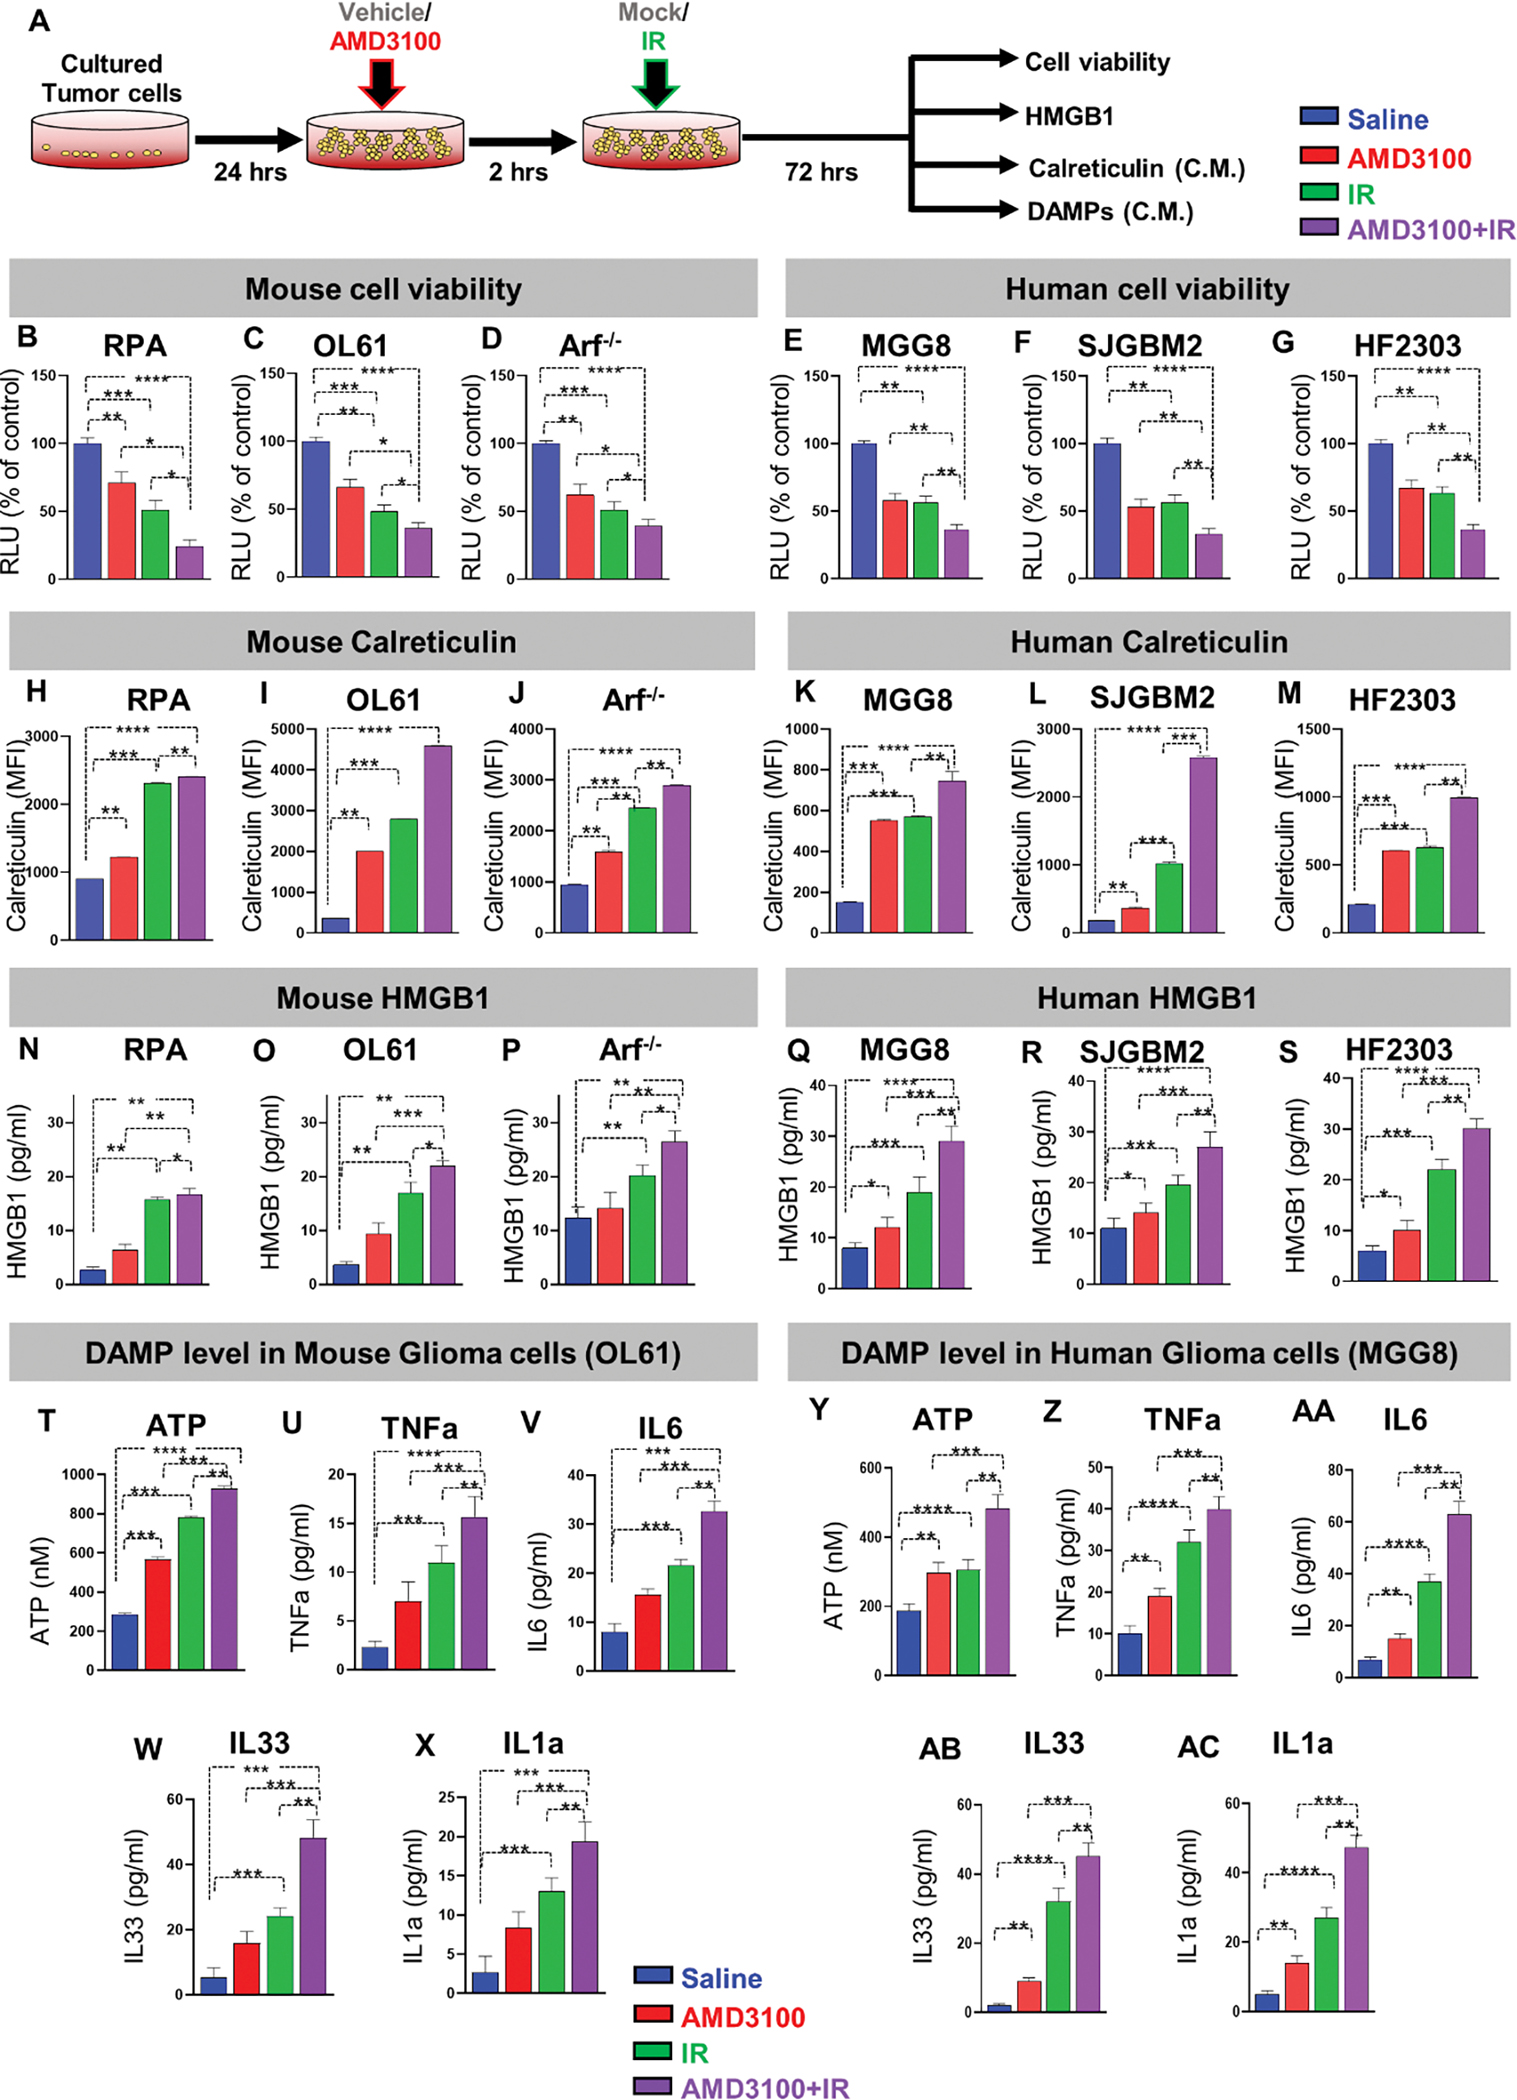
Figure 4. CXCR4 blockade enhances radio-sensitivity and immunogenic cell death in mouse and human glioma cells.

(A) Schematic shows the in vitro application of AMD3100 and/ or radiation in mouse and human cell cultures. Mouse and patient-derived glioma cells were treated with either free-AMD3100 or in combination with radiation at their respective IC50 doses for 72h. All mouse and human glioma cells were pre-treated with AMD3100 2h prior to irradiation with 3Gy and 10Gy of radiation respectively. (B-D) Bar plot shows the % viable mouse glioma cells (RPA, OL61, or Arf−/−) after treatment with saline, AMD3100, IR (3Gy), or AMD3100+IR. (E-G) Bar plot shows the % viable human glioma cells (MGG8, SJGBM2, or HF2303) after treatment with saline, AMD3100, IR (3Gy), or AMD3100+IR. (H-J) Bar graphs represent levels of immunogenic cell death (ICD) marker Calreticulin in mouse glioma cells (RPA, OL61, or Arf−/−) after treatment with saline, AMD3100, IR (3Gy), or AMD3100+IR. (K-M) Bar graphs represent levels of immunogenic cell death (ICD) marker Calreticulin in human glioma cells (MGG8, SJGBM2, or HF2303) after treatment with saline, AMD3100, IR (3Gy), or AMD3100+IR. (N-P) Bar graphs represent levels of immunogenic cell death (ICD) marker HMGB1 in mouse glioma cells (RPA, OL61, or Arf−/−) after treatment with saline, AMD3100, IR (3Gy), or AMD3100+IR. (Q-S) Bar graphs represent levels of immunogenic cell death (ICD) marker HMGB1 in human glioma cells (MGG8, SJGBM2, or HF2303) after treatment with saline, AMD3100, IR (3Gy), or AMD3100+IR. (T-AC) Quantitative ELISA show the levels of DAMPs (ATP, TNFα, IL6, IL33, IL1α), as markers for ICD in the mouse glioma cells OL61 and the human glioma cells MGG8 after treatment with saline, AMD3100, IR (3Gy), or AMD3100+IR. All AMD3100 treatment were done at IC50 values of the corresponding cell line alone or in combination with 3Gy of IR. (Blue= Saline red= AMD3100 alone, green= IR alone, violet= AMD3100 + IR). MFI= mean fluorescence intensity. ns= non-significant, *p< 0.05 **p< 0.01, ***p< 0.0001, ****p< 0.0001; unpaired t-test. Bars represent mean ± SEM (n= 3 biological replicates).
