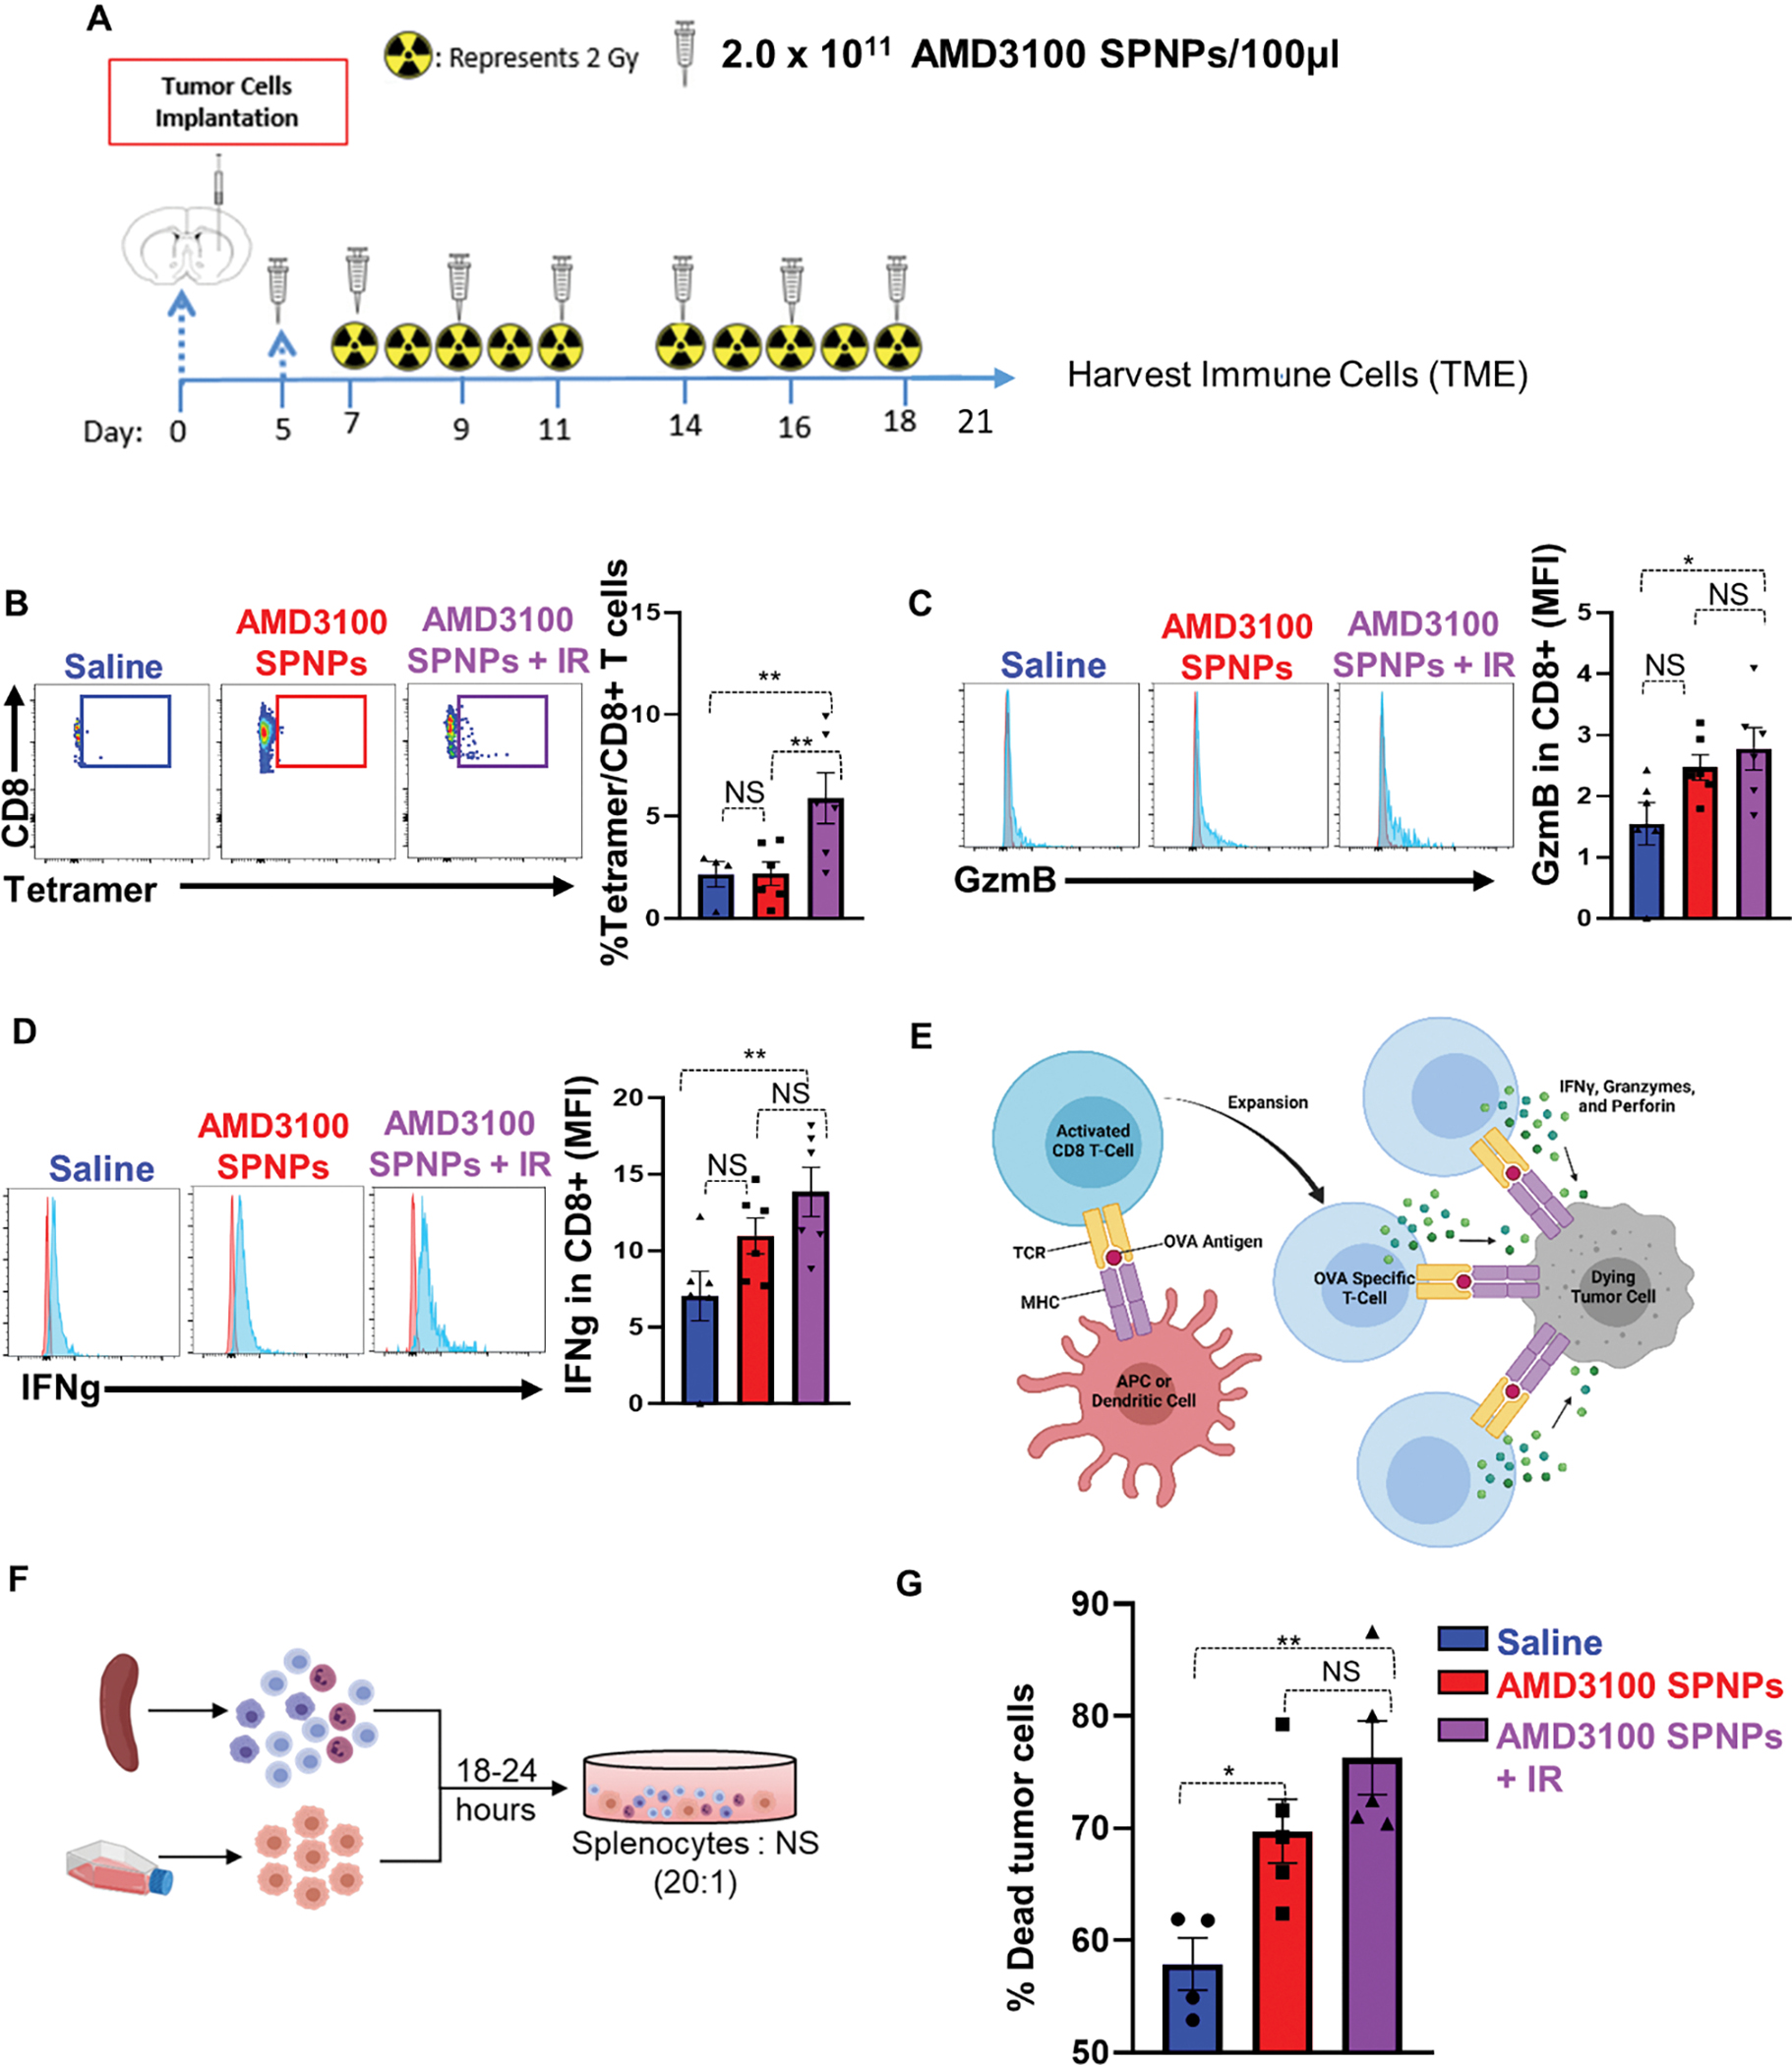
Figure 7. Combining AMD3100-SPNPs + IR enhances the adaptive antitumor immune response.

(A) Experimental design represents the timeline for the combination treatment of AMD3100-SPNPs + IR to assess the efficacy of GBM-infiltrating T cell function. (B) Representative flow cytometry plots and analysis represents the frequency of tumor specific CD8+ T cells within the TIME in saline, AMD3100-SPNPs, or AMD3100-SPNPs+ IR group. OL61-OVA tumors were analyzed by staining for the SIINFEKL-Kb tetramer. (C, D) Representative flow cytometry plots and analysis represent the expression of effector T cells molecules Granzyme B (GzmB) (C) and Interferon-g (IFN-γ) (D) in CD8 T cells in filtrating the TIME of each group. (E) Schematic represents the process of priming and expansion of OVA specific CD8 T cells which target OL61-OVA cells and triggers tumor cell death. (F) Schematic represents the killing assay of tumor cells co-cultured with splenocytes from each treatment group. (G) Quantitative analysis of the percentage of tumor cells death in co-culturing condition of OL61-OVA tumor cells with Splenocytes from OL61-OVA implanted mice treated with saline, AMD3100-SPNPs, or AMD3100-SPNPs+IR. Red histogram= isotype control, blue histogram= representative sample GzmB or IFN-γ expression. *p< 0.05 **p< 0.01, ***p< 0.0001, ****p<0.0001; One way ANOVA. Bars represent mean ± SEM. (n=4–5/group).
