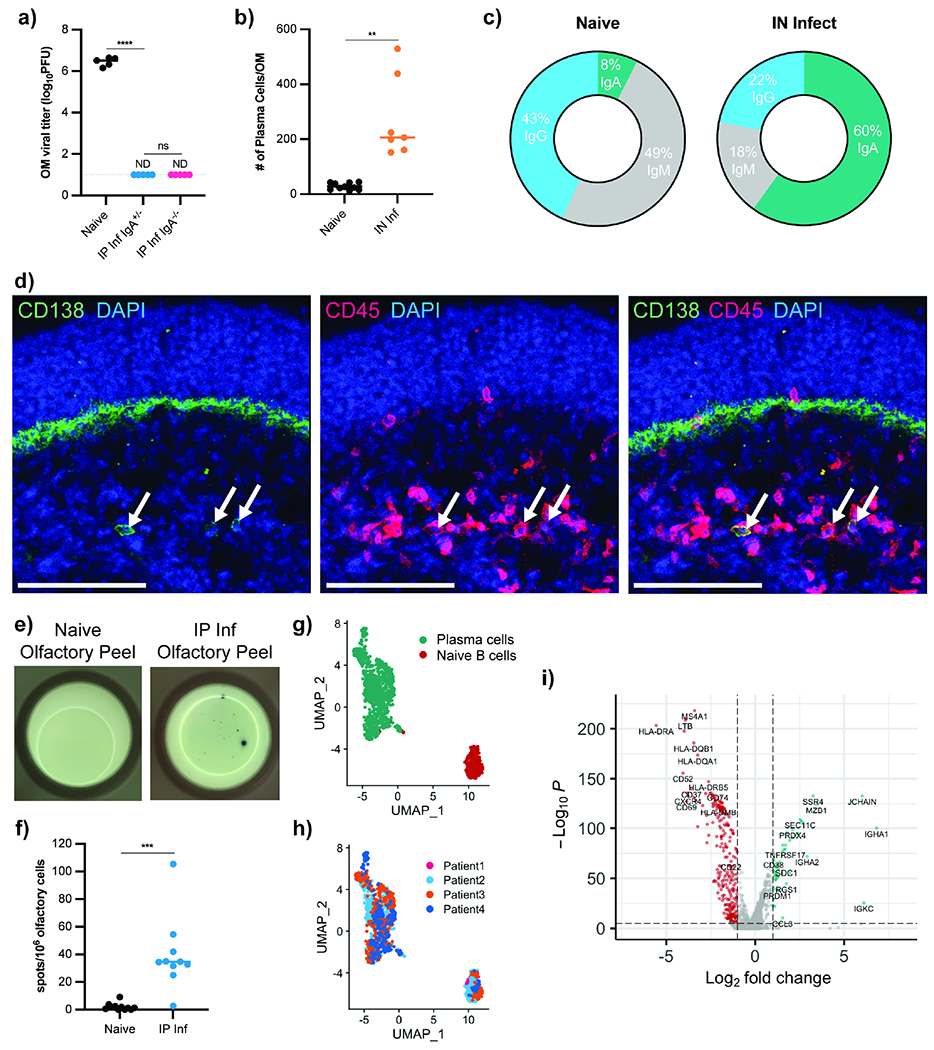
Figure 4 -. Plasma Cells Exist in Mouse and Human Olfactory Mucosa.

(a) OM VSV titers from IgA−/− (n = 5) and IgA+/− (n = 5) mice previously infected IN with VSV. At 35 dpi, mice rechallenged IN along with naïve IgA−/− mice (n = 5). OM VSV titers 48h after challenge. Data representative of two independent experiments. (b-c) Total OM plasma cells (b) and isotype proportions (c) from B6 mice infected with VSV IN (35 dpi, n = 7) and naïve mice (n = 9). Single cell OM suspensions gated on Live CD45+ IN labeled-CD45.2+ and either IgGhi, IgAhi, or IgMhi. Data pooled from two independent experiments. (d) Immunofluorescent staining of mouse OM 35d after IN VSV infection. Arrows indicate CD138+ CD45+ plasma cells. Blue = DAPI, Red = CD45, Green = CD138. Scale bars = 100 μm. (e-f) ELISpot to detect VSV-specific antibody-secreting cells. OM peeled from the septum of naïve (n = 10) or d35 IP infected (n =10) mice. Representative image (e) and quantification (f). Data pooled from two independent experiments. (g-i) Published human OM single cell RNA-seq data from 4 healthy patients reanalyzed to identify antibody-producing cells. (g) UMAP dimensional reduction analysis of the subset of antibody-producing cells. Cluster analysis identified plasma cells (green) and naïve B cells (red). (h) Original patient identity of each sample. (i) Volcano plot showing significantly differentially expressed genes (−log10(adj P value) > 5, log2(FC) > 1) between plasma cells (green) and naïve B cells (red). Statistical significance in (a) determined using Ordinary One-Way ANOVA for multiple comparisons. Parametric unpaired t-test with Welch’s correction used to assess statistical significance in (b) and (f). ND (not detected), ns (not significant), * P < 0.05, ** P < 0.01, *** P < 0.001, **** P < 0.0001. See also Figure S3.
