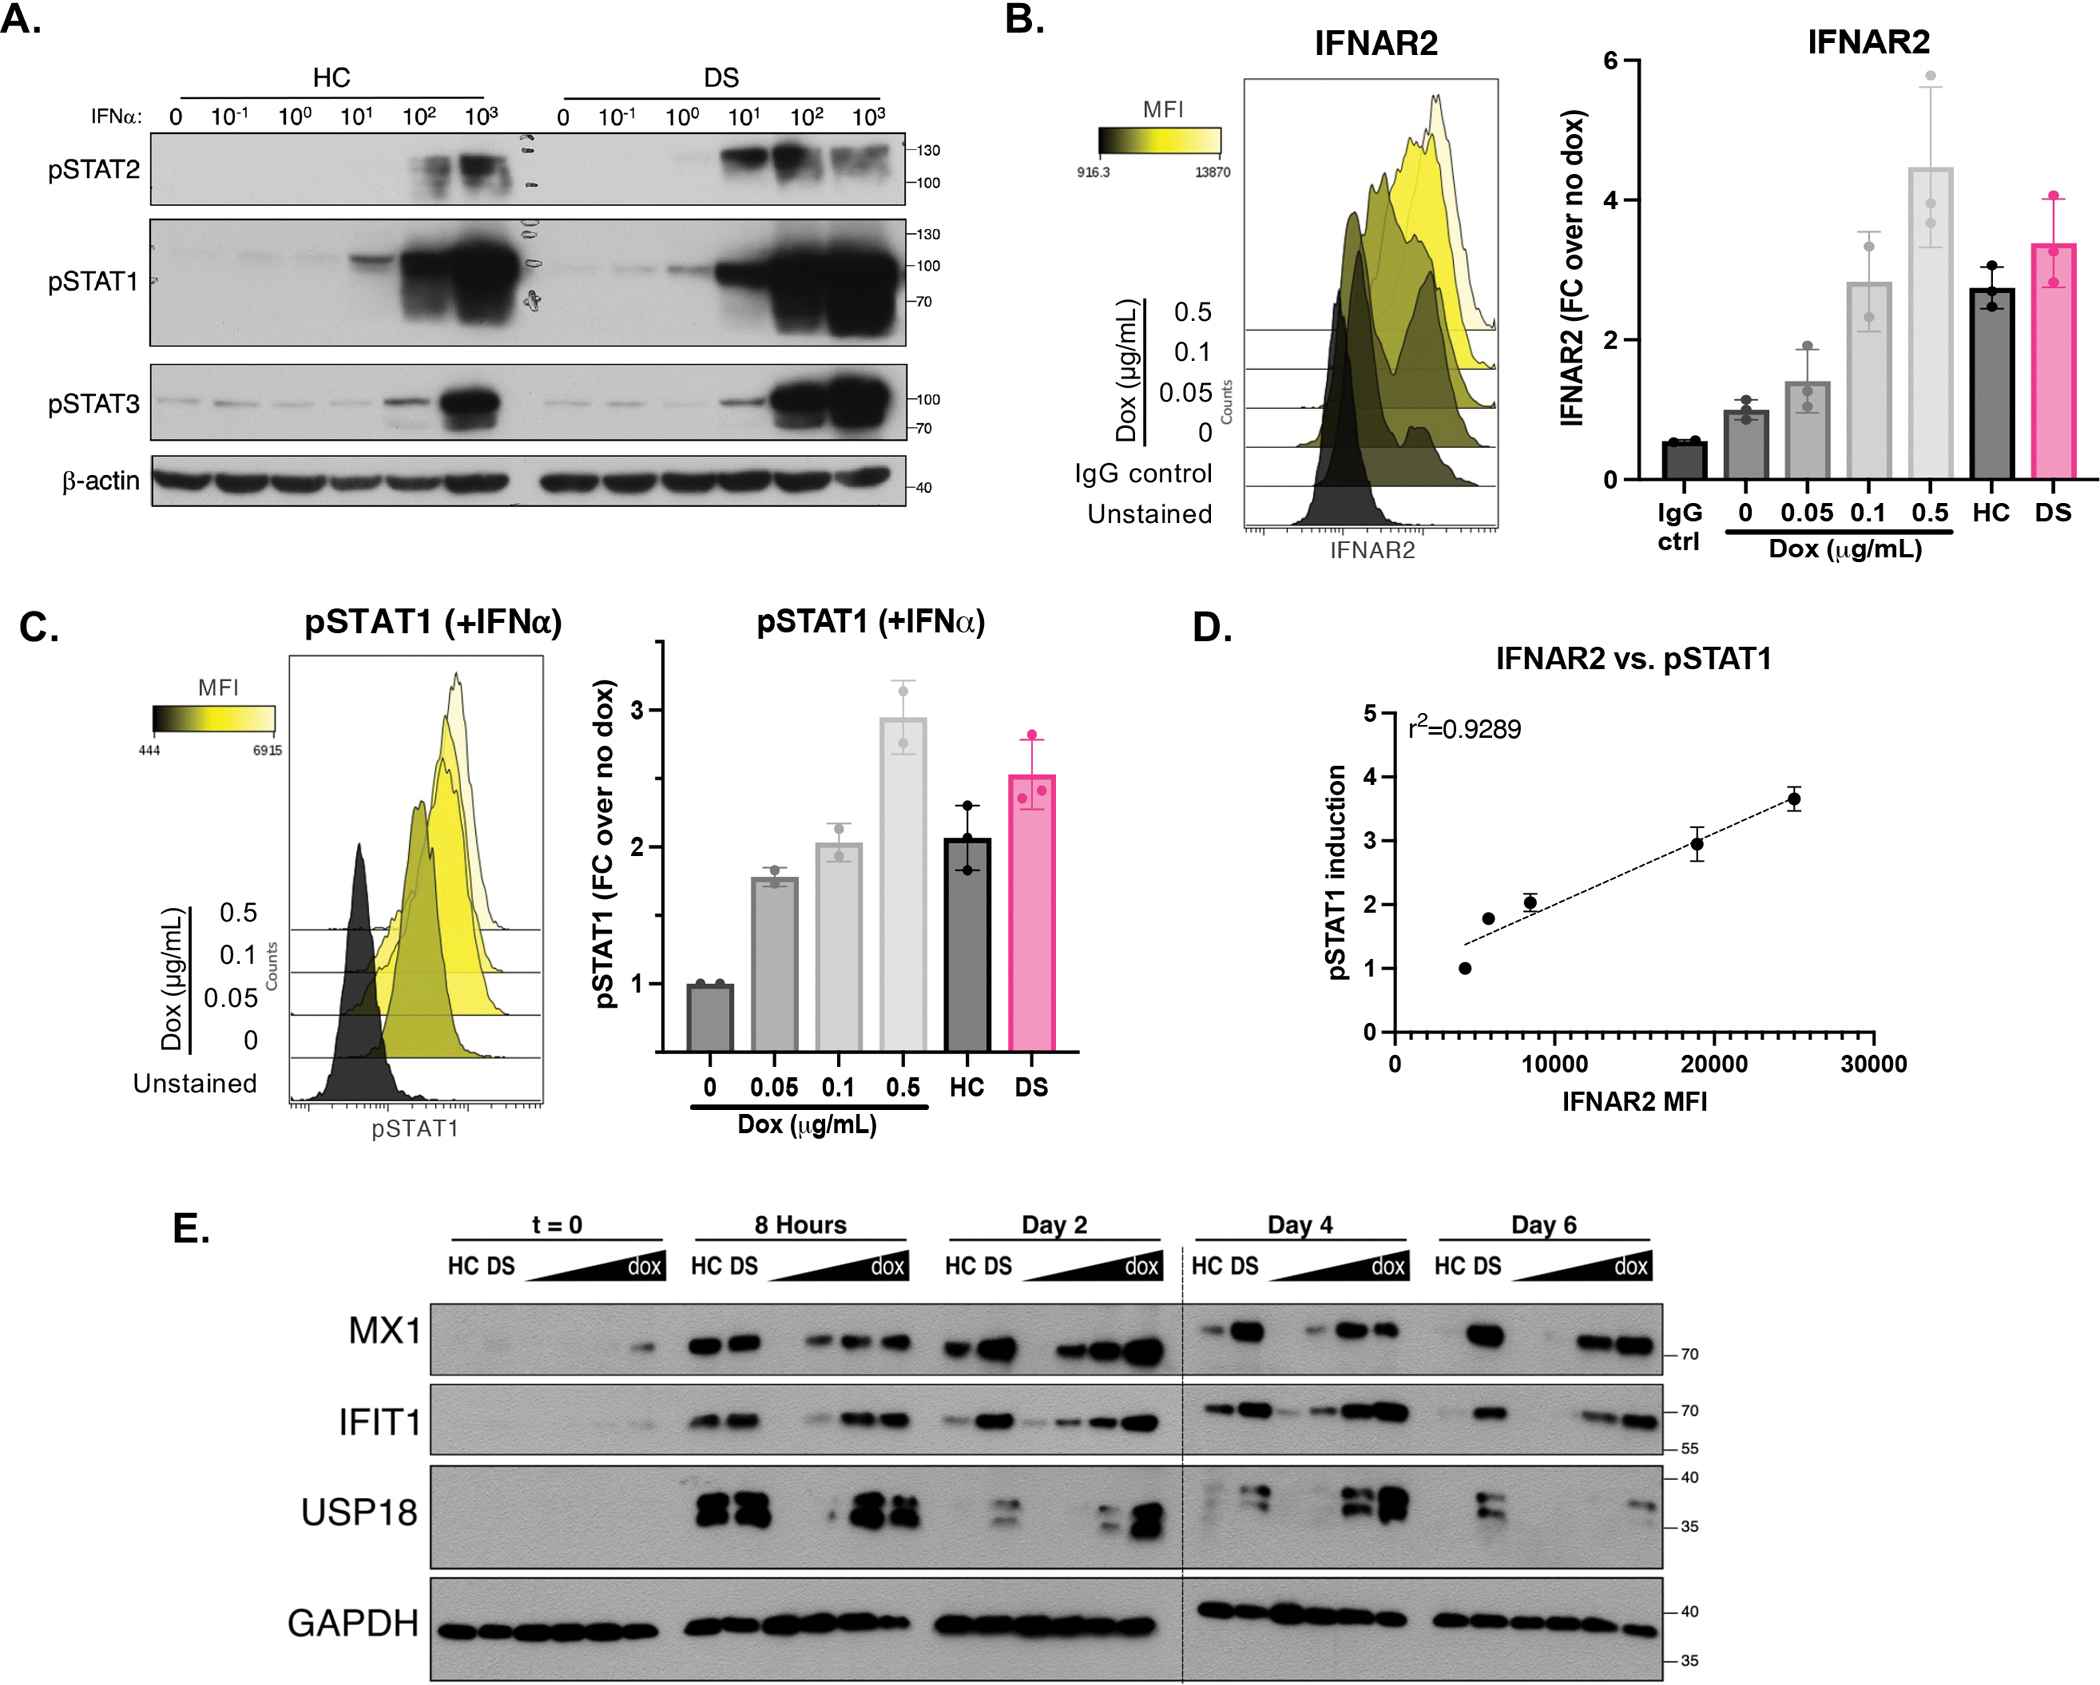
Figure 1. Hyper-response to IFN-I in Down syndrome, or with increased expression of IFNAR2 alone.

(A) Immunoblotting for STAT1, STAT2 and STAT3 phosphorylation in HC and DS hTERT-immortalized fibroblasts stimulated for 15 min with indicated doses of IFN-α (IU/mL). Result representative of fibroblasts derived from n=3 HCs and n=3 individuals with DS.
(B) Flow cytometry histogram and quantification of IFNAR2 expression in hTERT IFNAR2 knockouts complemented with doxycycline-inducible IFNAR2, treated with indicated amounts of doxycycline, run in triplicates.
(C) Flow cytometry histogram and quantification of STAT1 phosphorylation in hTERTs complemented with doxycycline-inducible IFNAR2, treated with increasing amounts of doxycycline (0, 0.05, 0.1, and 0.5 mg/mL) and stimulated with IFN-α for 15 minutes (1000 IU/mL), run in duplicates.
(D) Correlation of IFNAR2 expression and STAT1 phosphorylation in hTERTs complemented with dox-inducible IFNAR2. (r: Pearson correlation coefficient).
(E) Immunoblotting for ISG induction in hTERTs complemented with dox-inducible IFNAR2 treated with increasing amount of doxycycline followed by stimulation with IFN-α (10 IU/mL) for 8 hours, wash, and rest for indicated times. Result representative of fibroblasts derived from n=3 HCs and n=3 individuals with DS. * indicates samples were run on two separate gels.
For all results in the figure, bars represent the mean ± SD.
