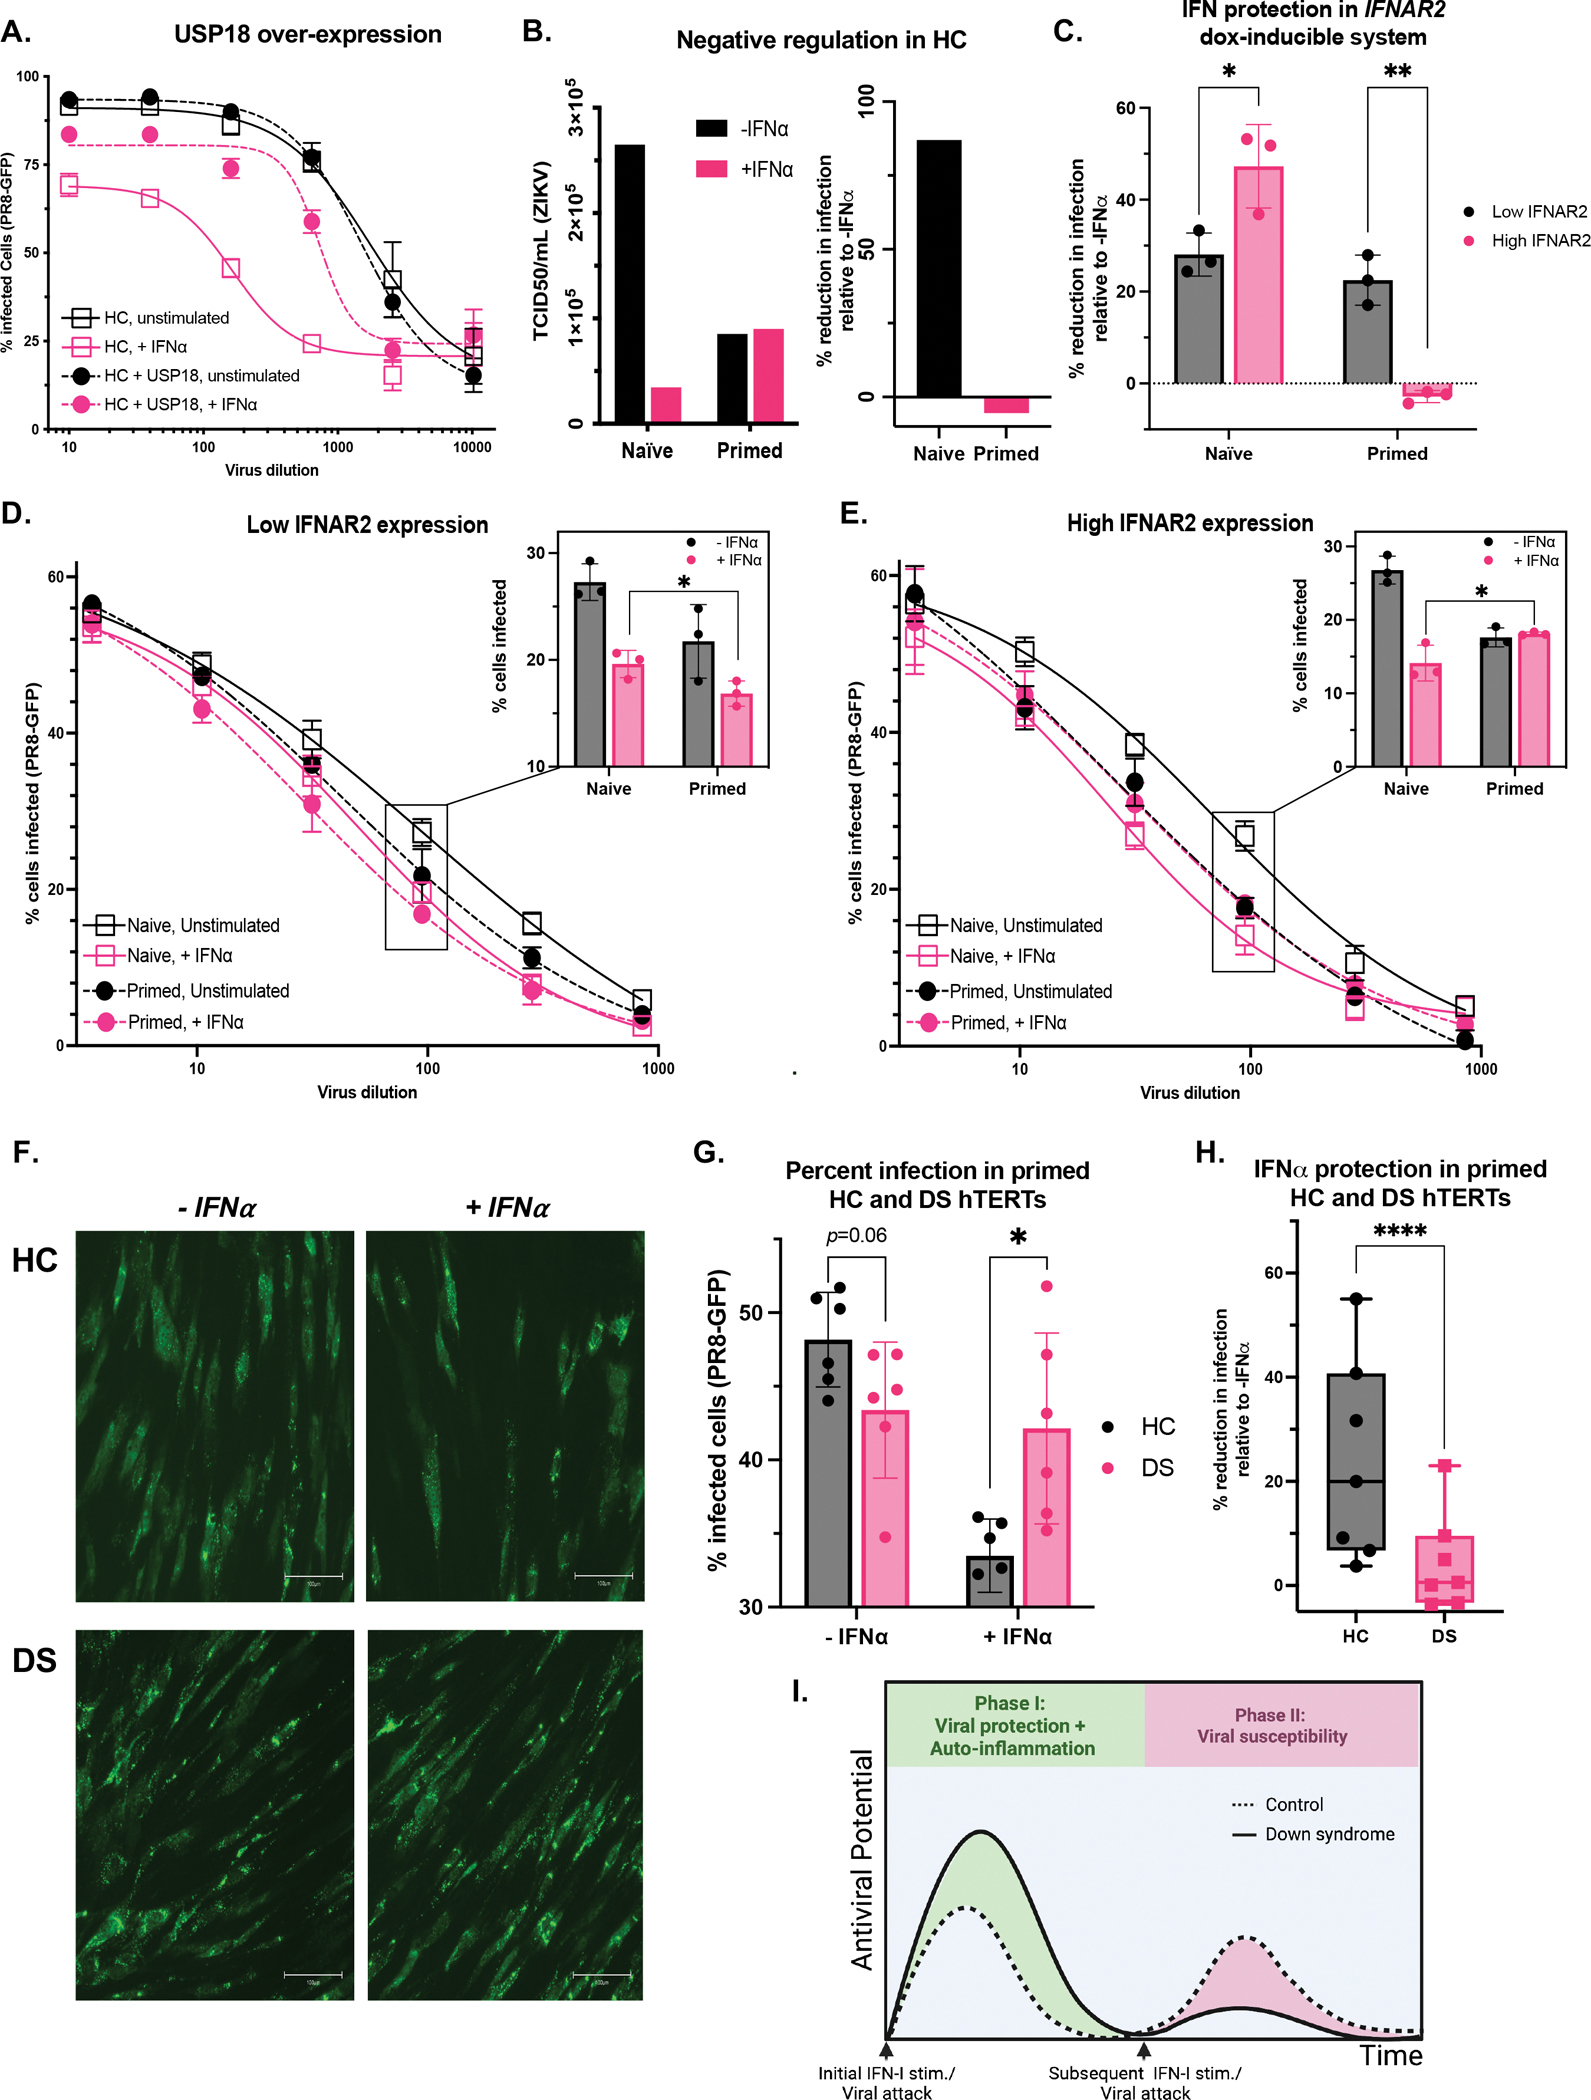
Figure 4. Increased IFN-I negative regulation underlies viral susceptibility.

(A) HC hTERTs transduced or not with USP18 were stimulated overnight with IFN-α (10 IU/mL) and infected with PR8-GFP for 8 hours.
(B) ZIKV was titrated on HC HTERTs that were naïve or primed for 8h with IFN-α (100 IU/mL), rested for 2.5 days, and restimulated with IFN-α (100 IU/mL) for 15 min, and infected with ZIKV 8 hours later. To calculate the TCID50, infected wells were considered GFP+ if they displayed a mean intensity above the mean of the un-infected wells.
(C-E) hTERT IFNAR2 knockouts complemented with doxycycline-inducible IFNAR2 were treated with 0.05 (“Low IFNAR2”) or 0.5 (“High IFNAR2”) μg/mL doxycycline. Cells were initially treated (Primed) or not (Naïve) with a primary stimulus of IFN-α (10 IU/mL) for 8 h, allowed to rest for 4.5 days in DMEM+Dox, and restimulated with IFN-α (1000 IU/mL) for 15-min followed by 8-hr rest and overnight infection with PR8-GFP. (C) Percent reduction in infection by IFN-I stimulation at 1:100 viral dilution. Raw percent infection at all viral dilutions tested (curves) and at 1:100 viral dilution (bar graphs) at (D) low and (E) high IFNAR2 levels.
(F-H) HC and DS hTERTs were initially treated with a primary stimulus of IFN-α (10 IU/mL) for 8 h, allowed to rest for 2.5 days, and restimulated with IFN-α (100 IU/mL) for 15-min followed by 8-hr rest and overnight infection with PR8-GFP. (F) PR8-GFP fluorescence captured at 20x (scale bar denotes 100μm) and (G) Raw percent infection at 1:100 viral dilution. (H) Percent reduction in infection by IFN-I stimulation at all viral dilutions tested. Results of n=2 independent experiments.
(I) Diagram of auto-inflammatory and immuno-suppressed states over time with subsequent IFN-α stimulations in HC and DS individuals.
For all results in the figure, bars represent the mean ± SD. Significance assessed by unpaired t tests, ns denotes p>0.05, *p ≤ 0.05; **p ≤ 0.005; ***p ≤ 0.0005.
