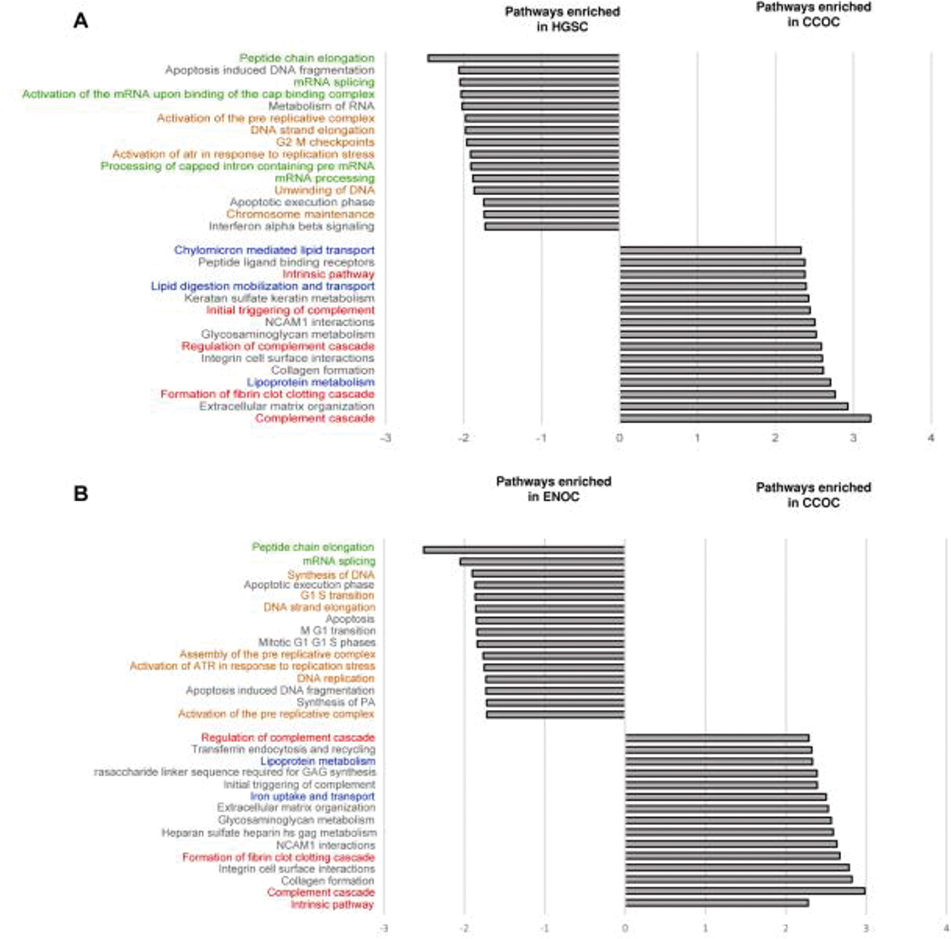
Figure 2.
Enriched pathways in a GSEA analysis comparing CCOC to ENOC and HGSC. GO annotation representing the top 15 enriched pathways in (A) CCOC and HGSC, and (B) CCOC and ENOC. All enriched pathways have an adjusted p value of less than 0.05. Red: coagulation related pathways; Blue: metabolism related pathways; Green: protein metabolism pathways; and orange: DNA synthesis pathways.

