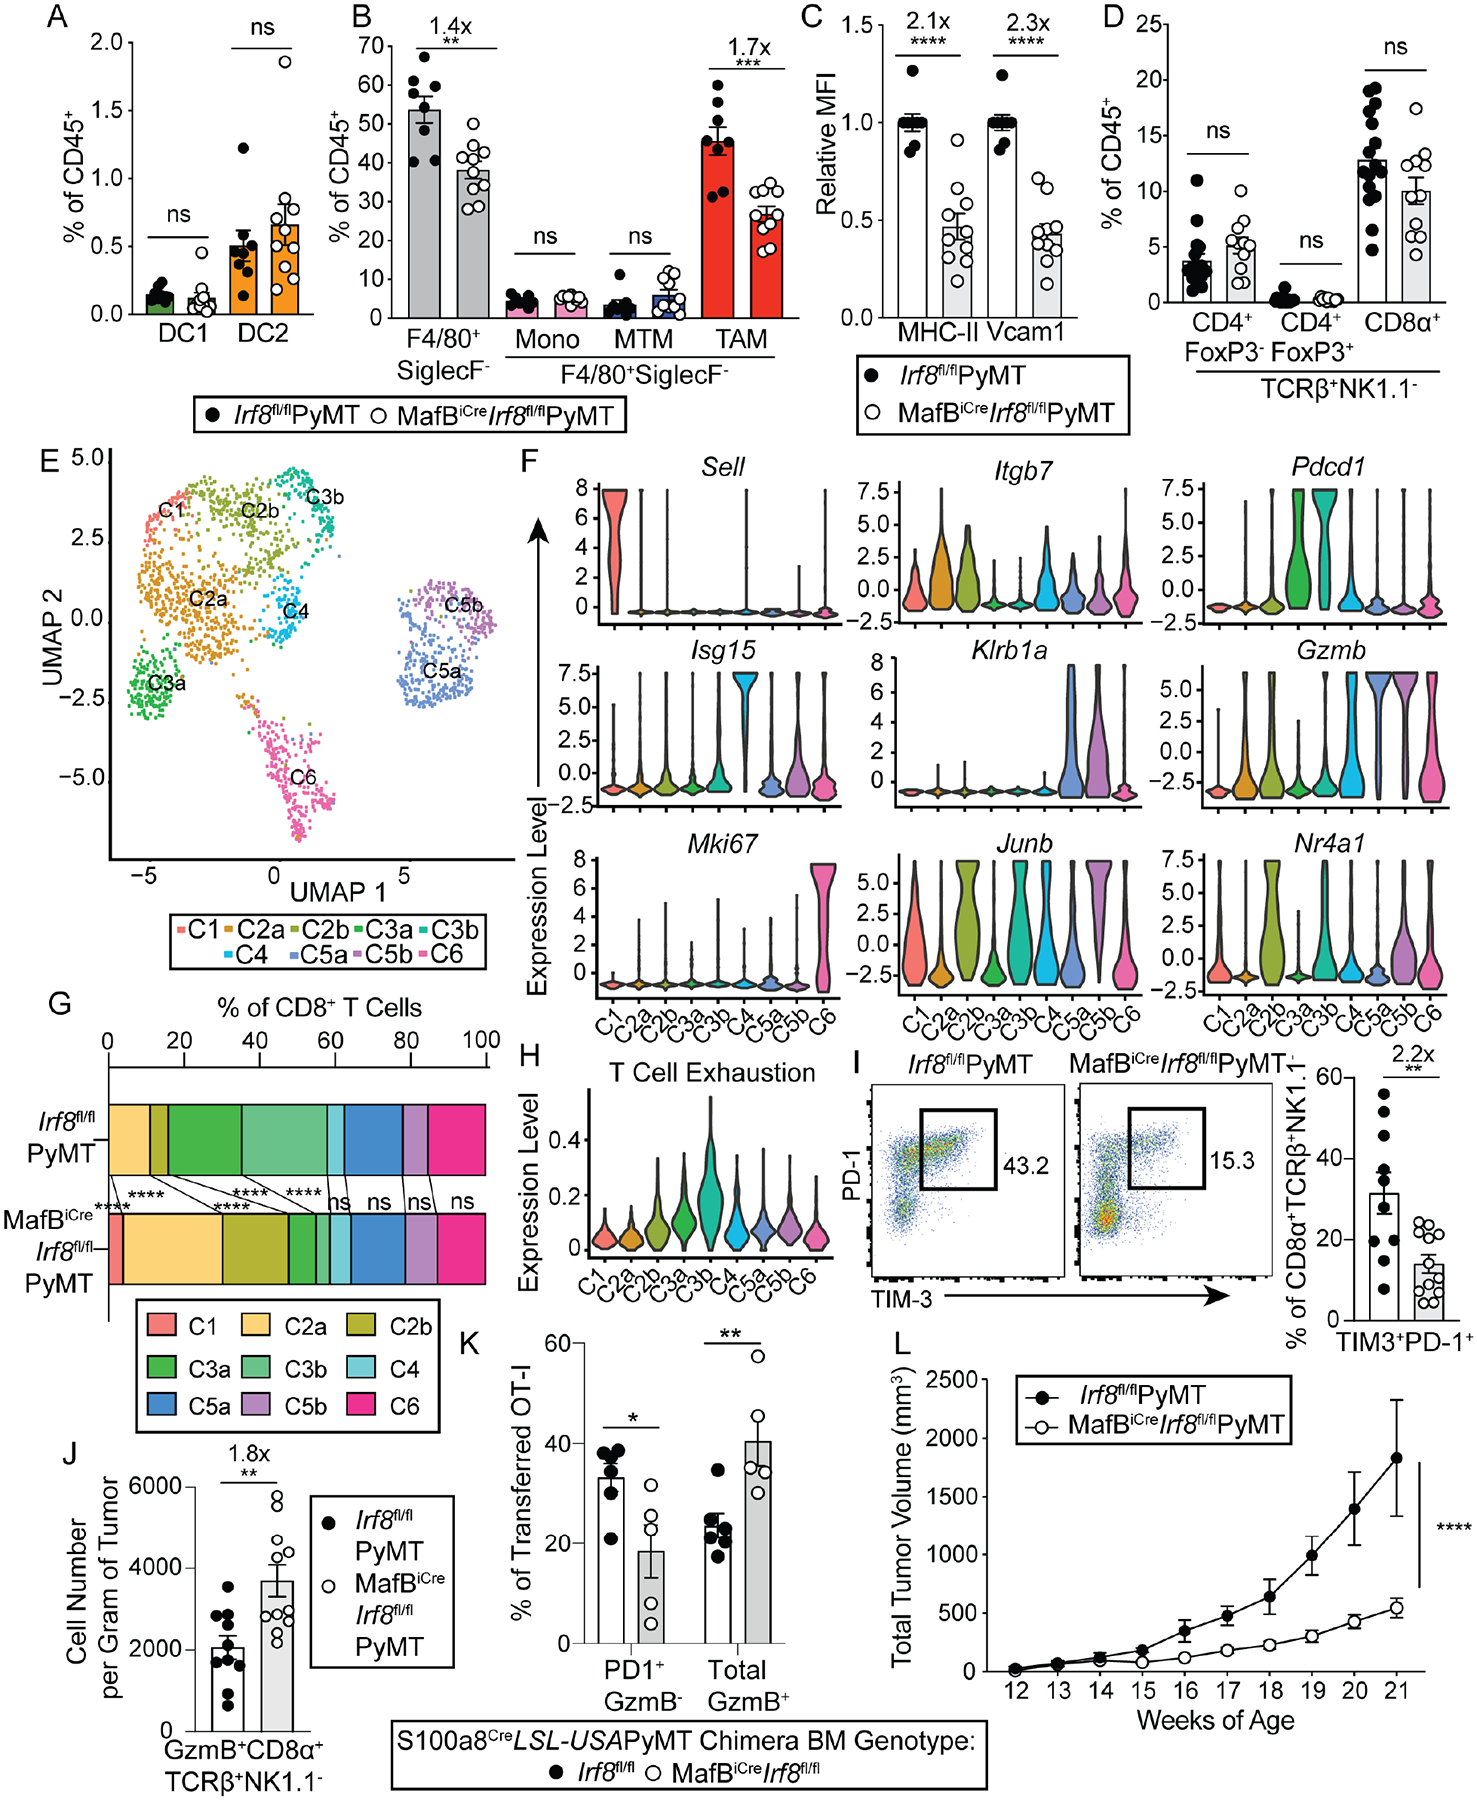
Figure 5. Macrophage-specific deletion of IRF8 attenuates CTL exhaustion in the tumor.

(A) Quantification of tumor-infiltrating dendritic cells in Irf8fl/flPyMT (black circles, n=8) and MafBiCreIrf8fl/flPyMT (white circles, n=10) mice. DC1 (green), and DC2 (orange) are shown.
(B) Quantification of tumor-infiltrating monocyte/macrophage lineage of cells in Irf8fl/flPyMT (black circles, n=8) and MafBiCreIrf8fl/flPyMT (white circles, n=10) mice. Total F4/80+SiglecF− cells (gray), monocytes (pink), MTMs (blue), and TAMs (red) are shown.
(C) Quantification of relative geometric mean fluorescence intensity (MFI) of MHC-II and Vcam1 relative to Irf8fl/flPyMT TAMs, MFI indicated on representative plot (Irf8fl/flPyMT n=8, MafBiCreIrf8fl/flPyMT n=10).
(D) Quantification of tumor-infiltrating conventional and regulatory CD4+ and conventional CD8+ T cells in Irf8fl/flPyMT (n=16) and MafBiCreIrf8fl/flPyMT (n=11) mouse tumors.
(E) UMAP projection of single-cell RNA sequencing (scRNAseq) clusters of TCRβ+CD8α+ cells sorted from multiple tumors of one Irf8fl/flPyMT and one MafBiCreIrf8fl/flPyMT mouse.
(F) Violin plots showing normalized expression of select genes across all 9 clusters from scRNAseq dataset.
(G) Abundance of each cluster as a proportion among total cells within Irf8fl/flPyMT or MafBiCreIrf8fl/flPyMT tumors.
(H) Violin plot showing normalized expression of a T cell exhaustion gene signature across all 9 clusters.
(I) Representative plots and quantification of flow cytometric analysis of co-expression of PD-1 and TIM-3 in TCRβ+NK1.1−CD8α+ T cells from tumors of Irf8fl/flPyMT (n=10) and MafBiCreIrf8fl/flPyMT (n=12) mice.
(J) Quantification of flow cytometric analysis of number of GzmB+TCRβ+NK1.1−CD8α+ cells per gram of tumor in Irf8fl/flPyMT (black line, circles) (n=10) and MafBiCreIrf8fl/flPyMT (gray line, circles) (n=11) mice.
(K) Quantification of flow cytometric analysis of PD-1 and GzmB expression in OT-I T cells two weeks after transfer to tumor-bearing S100a8CreLSL-USAPyMT chimeric mice reconstituted with either Irf8fl/fl (black circles, n=6) or MafBiCreIrf8fl/fl (white circles, n=5) bone marrow.
(L) Tumor measurements from MafBiCreIrf8fl/flPyMT and littermate and cagemate Irf8fl/flPyMT controls (n=7 each). All data are shown as mean +/− SEM, fold change of means are displayed above significant comparisons. (A, B, C, D, I, J, K) Each circle represents pooled tumors from one mouse; comparably sized tumors were selected between mice, unpaired student’s t-test, two-tailed, ** = p<0.01, *** = p<0.001, **** = p<0.0001. G: Fisher’s Exact Test, **** = p<0.0001 J: 2-way ANOVA **** = p<0.0001.
See also Figures S5–S6 and Table S5.
