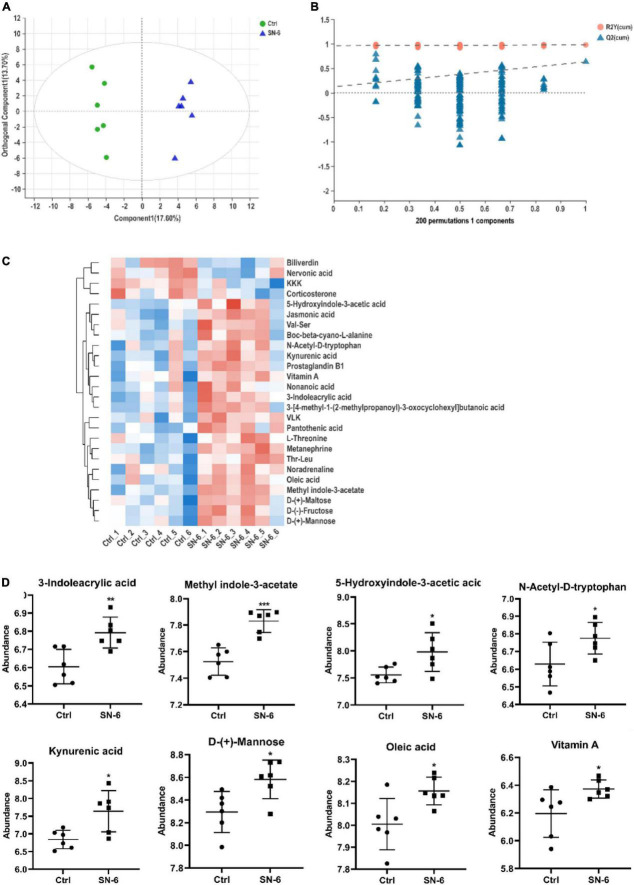
FIGURE 5.
Effects of SN-6 on the fecal metabolism of Simmental. (A) The orthogonal projection to latent structures discriminant analysis (OPLS-DA) score plot between the control and SN-6 groups. (B) Two hundred times permutations of OPLS-DA plot between the control and SN-6 groups. (C) Heatmap overview of 26 differential metabolites in feces throughout control and SN-6 groups. (D) Effect of SN-6 on the abundance of potential metabolites in fecal samples. Data are shown as mean ± SD (n = 6). *p < 0.05, **p < 0.01, ***p < 0.001.

