Figure 2.
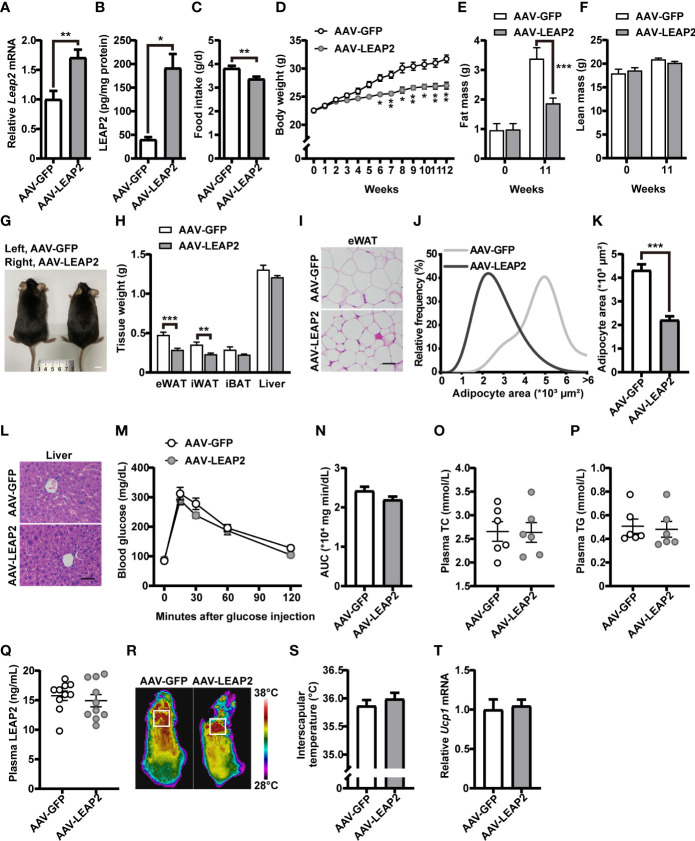
LEAP2 overexpression in the ARC of mice reduces food intake and body weight without altering metabolism on a chow diet. (A) Relative Leap2 mRNA expression in the hypothalamus of mice injected with AAV-GFP or AAV-LEAP2 at 4 weeks after virus injection on a chow diet. n = 6/group, two-tailed Student’s t-test, t = 3.560, ** p = 0.0052< 0.01. (B) Hypothalamic content of LEAP2 peptide in mice injected with AAV-GFP or AAV-LEAP2 at 4 weeks after virus injection on a chow diet. n = 4/group, two-tailed Student’s t-test, t = 5.019, * p = 0.0132< 0.05. (C–F) LEAP2 overexpression in the ARC reduced food intake (C), weekly body weight (D), and total fat mass (E), without affecting total lean mass (F), assessed in normal chow-fed mice during the 12 weeks after virus injection. n = 8/group, two-tailed Student’s t-test, t = 3.218, ** p = 0.0062< 0.01 (C). n = 8/group, two-way ANOVA with Bonferroni’s post-hoc test, F (1, 14) = 28.70, *** p = 0.0001< 0.001 for virus (D). n = 6–8/group, two-way ANOVA with Bonferroni’s post hoc test, F (1, 24) = 7.577, * p = 0.0111< 0.05 for virus, *** p = 0.0005< 0.001, 11 weeks (E); F (1, 24) = 0.01153, p = 0.9154 for virus (F). (G) Representative photograph of mice fed a chow diet and injected with AAV-GFP or AAV-LEAP2 12 weeks after virus injection. Scale bars, 1 cm. n = 8/group. (H) Individual fat tissue and liver weights of mice fed a chow diet and injected with AAV-GFP or AAV-LEAP2 12 weeks after virus injection. n = 8/group, two-tailed Student’s t-test, t = 4.532, *** p = 0.0005< 0.001 for eWAT; t = 3.461, ** p = 0.0065< 0.01 for iWAT. (I) H&E-stained sections of eWAT from mice fed a chow diet and injected with AAV-GFP or AAV-LEAP2 at 12 weeks after virus injection. Scale bar, 50 μm. (J, K) Distribution of adipocyte area (J) and the average area (K) in eWAT. n = 5/group, two-tailed Student’s t-test, t = 7.111, *** p = 0.0001< 0.001 (K). (L) Representative images of liver histology with H&E staining in mice fed a chow diet and injected with AAV-GFP or AAV-LEAP2 at 12 weeks after virus injection. Scale bar, 50 μm. (M, N) No difference was observed in the glucose tolerance test (GTT) at week 11 after virus injection (M). The corresponding area under the curve (AUC) of the GTT (M) was calculated (N). n = 7/group, two-way ANOVA, F (1, 12) = 2.837, p = 0.1180 (M); two-tailed Student’s t-test, p > 0.05 (N). (O, P) No difference was observed in fasting plasma TC (O) and TG (P) levels of the mice fed a chow diet for 12 weeks. n = 6/group, two-tailed Student’s t-test, p > 0.05. (Q) No difference was observed in fasting plasma LEAP2 levels of the mice fed a chow diet for 12 weeks. n = 10/group, two-tailed Student’s t-test, p > 0.05. (R, S) Representative infrared thermography of mice fed a chow diet at week 12 after virus injection (R). Surface temperature in the interscapular BAT area represented by a square was quantified (S). n = 8/group, two-tailed Student’s t-test, p > 0.05 (S). (T) Relative Ucp1 mRNA expression in BAT had no change in the AAV-LEAP2 group compared to the AAV-GFP group fed a chow diet for 12 weeks. n = 5/group, two-tailed Student’s t-test, p > 0.05. Data are presented as mean ± SEM. ** p< 0.01; *** p< 0.001.

