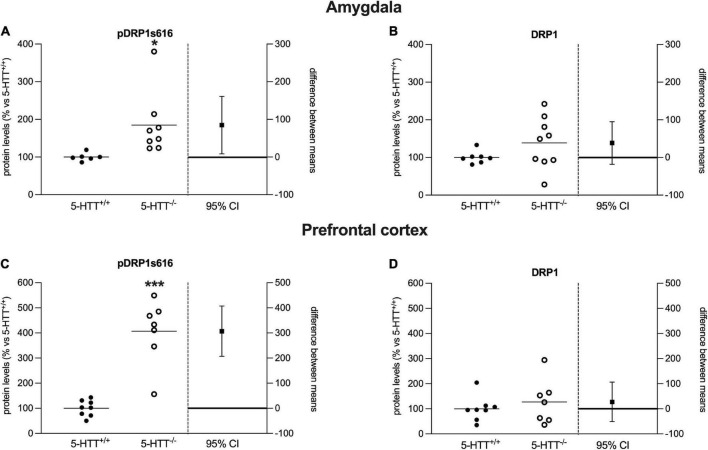
FIGURE 3.
Analysis of DRP1 (phospho Ser616, total) protein levels in the amygdala (A,B) and in the prefrontal cortex (C,D) of 5-HTT+/+ and 5-HTT–/– rats. The results are represented as Gardner–Altman plots. The black square shows the difference between the two means, and the error bar shows the 95% confidence interval of that difference. The data are expressed as a percentage of 5-HTT+/+ (set at 100%) of 6 to 10 independent determinations. *p < 0.05, ***p < 0.001 vs. 5-HTT+/+ (Unpaired t-test).

