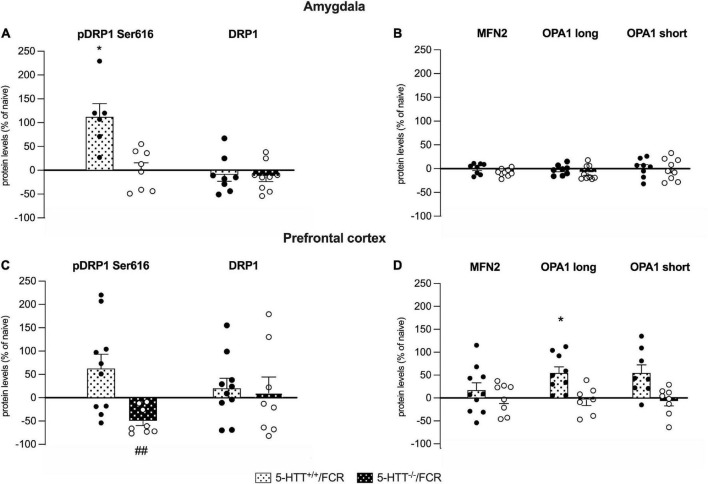
FIGURE 7.
Analysis of the protein levels of the fission (pDRP1 Ser616 and total DRP1) and fusion machinery (MFN2, OPA1 long and short isoforms) in the amygdala (A,B) and in the prefrontal cortex (C,D) of 5-HTT+/+ and 5-HTT–/– rats exposed to fear extinction recall (FCR). The data are expressed as a percentage of 5-HTT+/+/naive and 5-HTT–/–/naive and represent the mean ± SEM of 6 to 10 independent determinations. *p < 0.05 vs. 5-HTT+/+/naive; ##p < 0.01 vs. 5-HTT–/t–/naïve (Two-way Anova with Tukey).

