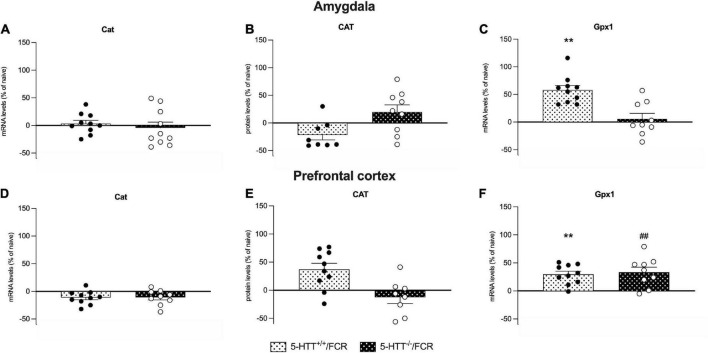
FIGURE 9.
Analysis of Cat mRNA and protein levels and Gpx-1 mRNA levels in the amygdala (A–C) and prefrontal cortex (D–F) of 5-HTT+/+ and 5-HTT–/– rats exposed to fear extinction recall (FCR). The data are expressed as a percentage of 5-HTT+/+/naive and 5-HTT–/–/naive and represent the mean ± SEM of 6 to 10 independent determinations. **p < 0.01 vs. 5-HTT+/+/naive; ##p < 0.01 vs. 5-HTT–/–/naïve (Two-way Anova with Tukey).

