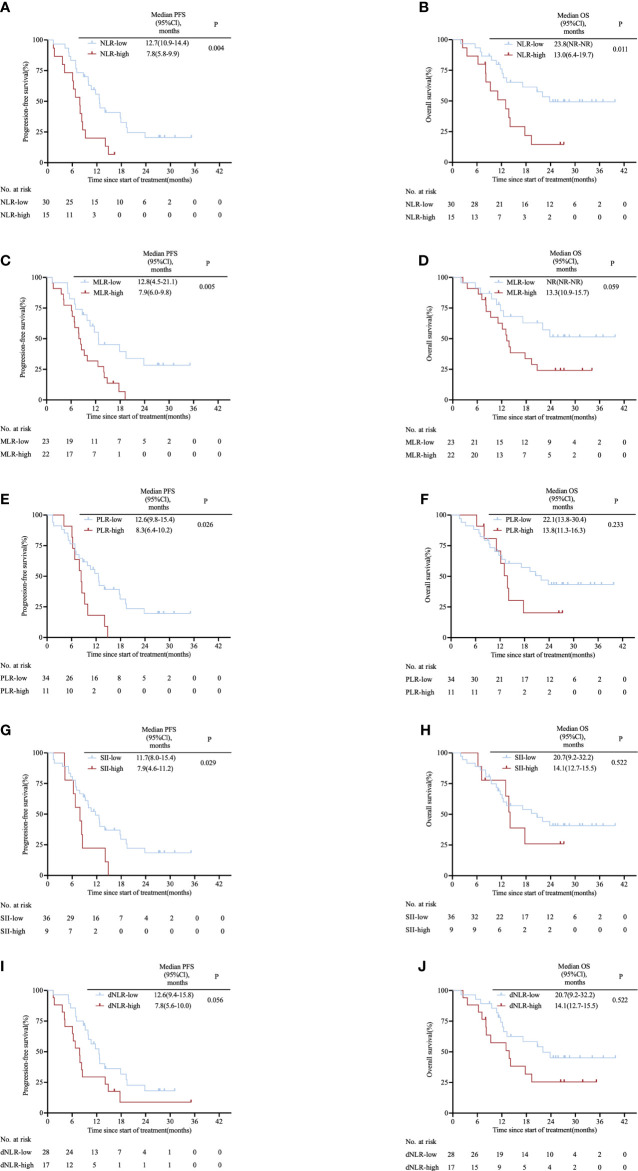
Figure 1.
Kaplan–Meier survival curves in the clinical trial cohort stratified by inflammatory markers for (A) PFS for NLR cut-off, (B) OS for NLR cut-off, (C) PFS for MLR cut-off, (D) OS for MLR cut-off, (E) PFS for PLR cut-off, (F) OS for PLR cut-off, (G) PFS for SII cut-off, (H) OS for SII cut-off, (I) PFS for dNLR cut-off and (J) OS for dNLR cut-off. The p values were calculated using the log-rank test (two-sided). CI, confidence interval; dNLR, derived neutrophil-to-lymphocyte ratio; MLR, monocyte-to-lymphocyte ratio; NLR, neutrophil-to-lymphocyte ratio; OS, overall survival; PLR, platelet-to-lymphocyte ratio; PFS, progression-free survival; SII, systemic immune-inflammation index.

