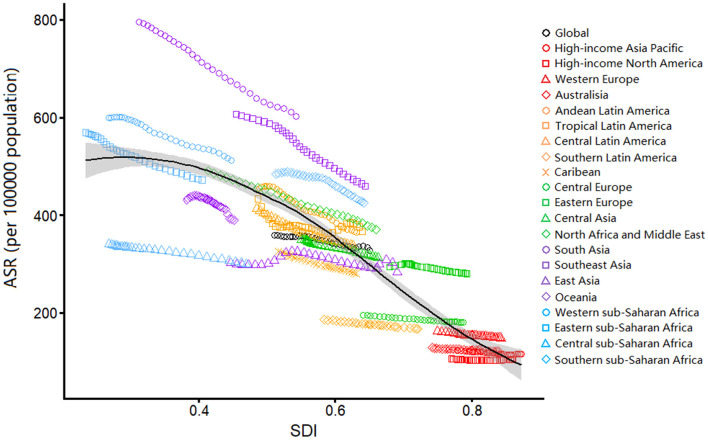
Figure 4.
Age-standardized YLDs rates due to blindness and vision loss by SDI, 1990–2019, and expected value-based SDI. Age-standardized YLD rates are plotted for 21 geographic regions between 1990 to 2019 against their SDIs. Points in each line from left to right represents the values from 1990 to 2019. The black line represents the average expected relationship between SDI and age-standardized YLD rates due to blindness and vision loss based on values from all countries over the 1990–2019 estimation period. ASR, age-standardized rate; YLD, years lived with disability; SDI, human development index.

