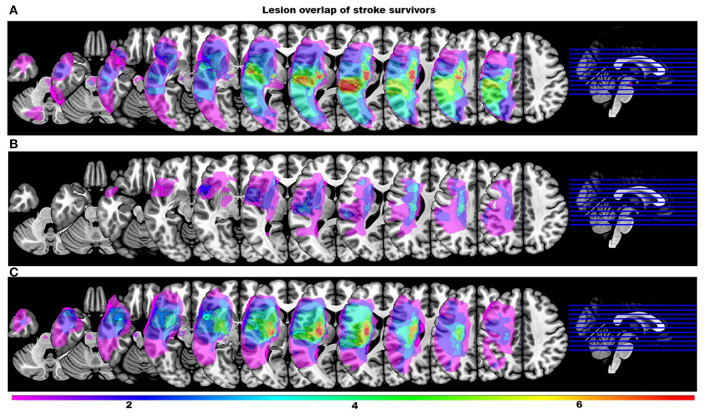
Figure 1.
Lesion overlay maps of stroke survivors stratified by the number of modules. Color scale indicates the number of stroke survivors having a lesion in every voxel (all right sided lesions are flipped to the left hemisphere for clarity). (A) Overlay maps of stroke survivors with more than two modules. (B) Overlay maps of stroke survivors with two modules that were incorrectly classified by the classification tree as individuals with more than two modules. (C) Overlay maps of stroke survivors with two modules correctly classified by the classification tree.

