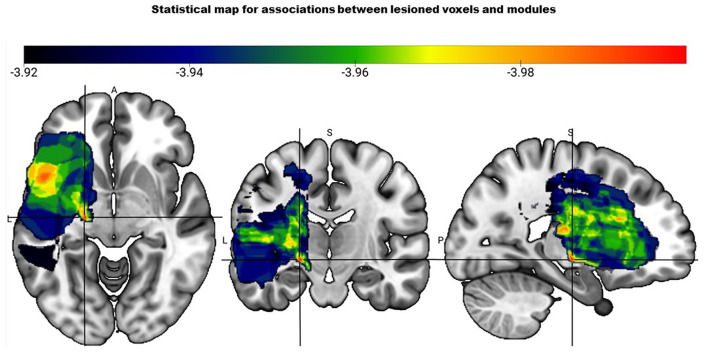
Figure 2.
Statistical map based on the voxel-based lesion mapping analysis shows the association between number of modules and lesioned voxels. Color scale indicates strength of association between two module pattern and lesion location with red having the strongest association (represented by the crosshair).

