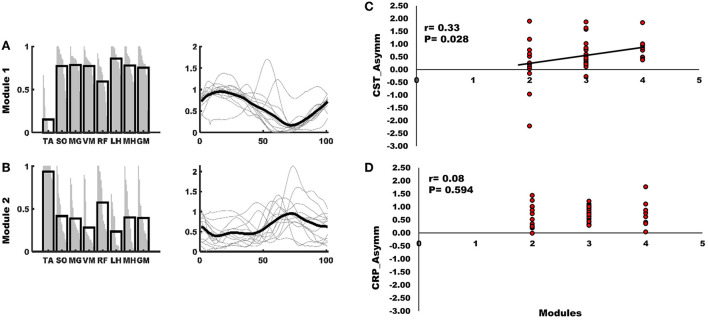
Figure 5.
(A) Module one of the mass flexion-extension pattern had greater activity of SO, MG, VM, LH, MH, and GM and was primarily active during stance. (B) The second module of the mass flexion-extension pattern had greater activity of TA and RF and was primarily active during swing. Each black bar on the left panel of (A,B) indicates group mean of the representation of a muscle within the module and each gray line within the black bar represents a subject. Black line on the right panel of A and B indicates the group mean and gray lines represent the activity profile of the module for each subject. (C) The AsymmStroke for CST (i.e., fewer CST streamlines on the lesioned hemisphere) were positively correlated with number of modules. (D) The correlation between AsymmStroke for CRP (i.e., fewer CRP streamlines on the lesioned hemisphere), and number of modules was not statistically significant (p < 0.05).

